Another brilliant visualisation from UCL’s CASA, this time from Anil Bawa-Cavia. It visualises trips made on the London Underground using data gathered from Oyster Cards. Each trail is
More...
Highlighting the best London maps

Another brilliant visualisation from UCL’s CASA, this time from Anil Bawa-Cavia. It visualises trips made on the London Underground using data gathered from Oyster Cards. Each trail is
More...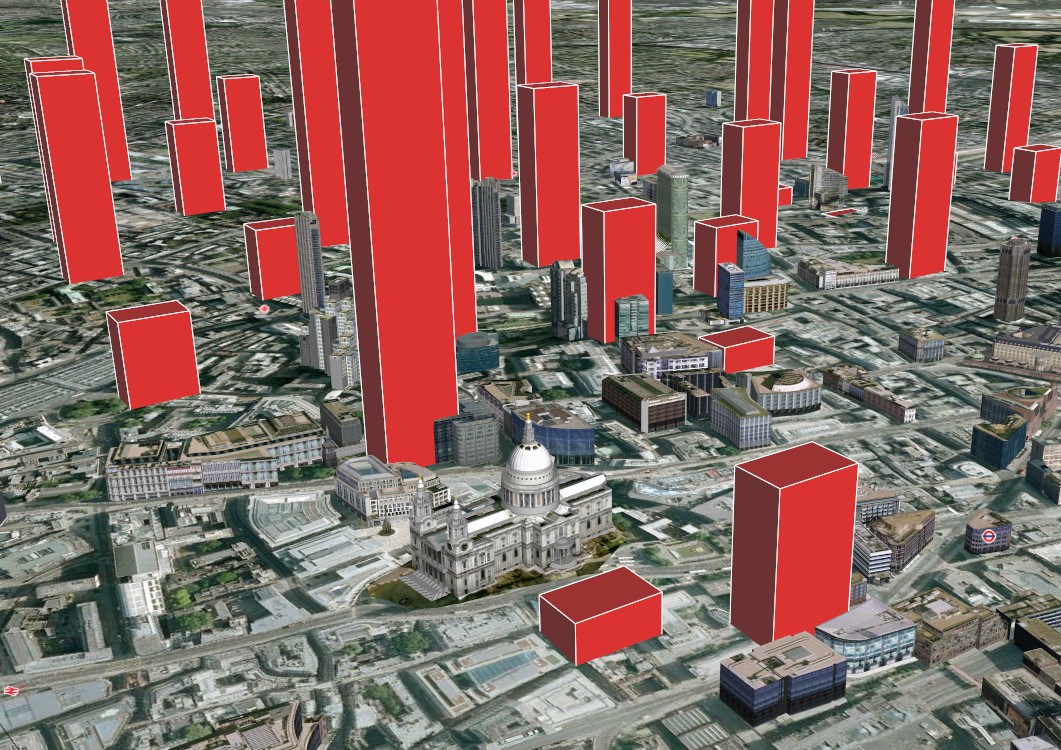
Adrian Short, provider of one of the main 3rd-party APIs for the Barclays Cycle Hire scheme in London – the Boris Bikes API – has
More...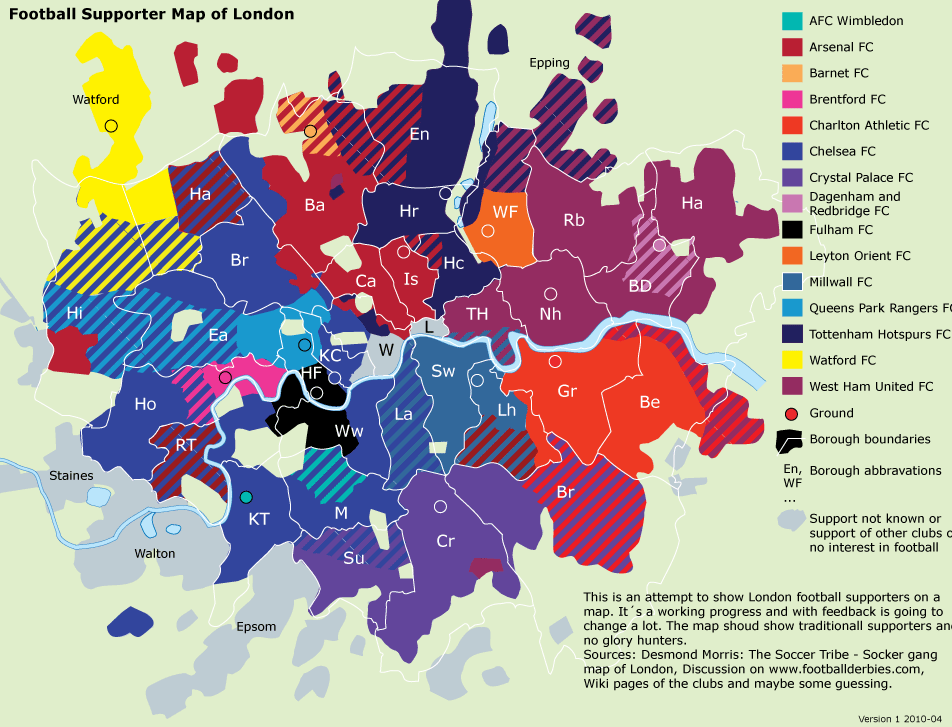
Two interesting maps of football clubs and London: First, Dean of The Londonist has mapped out the various locations of London’s football clubs over time.
More...
Some of us at CASA can’t get enough of the Barclay’s Cycle Hire data. We have had Ollie‘s hugely successful flow maps, journeytime heat maps, and now the the Sociable Physicist himself,
More...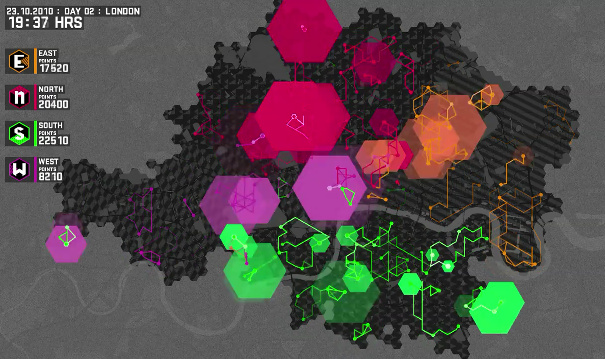
The Nike Grid was an Alternative Reality Game (ARG) for runners, held over two weeks on the streets of London late last year. After each
More...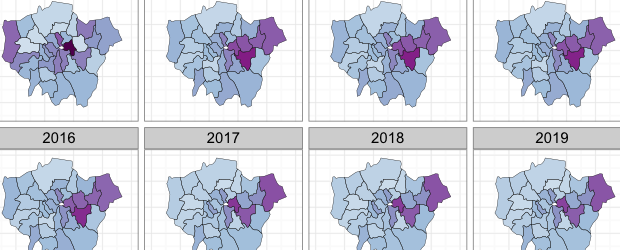
Buried in the London Datastore are the population estimates for each of the London Boroughs between 2001 – 2030. They predict a declining population for most
More...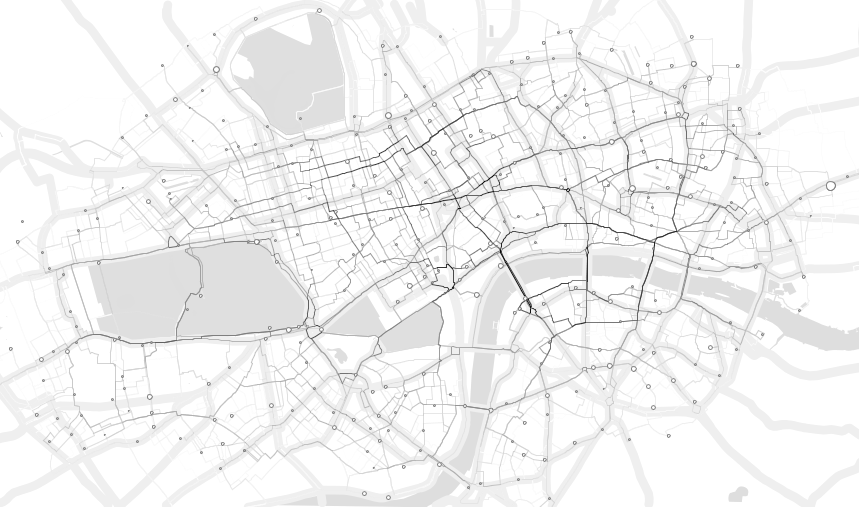
Demeter Sztanko has produced a stunning, minimalistic visualisation of the routes of the first 1.4 million Barclays Cycle Hire bikes. It is assumed that the
More...
Ollie O’Brien, one of the contributors to this blog, has produced a map, which updates in near-real-time, of the full/empty states of the 350-odd docking
More...