Perhaps the world’s most famous historical geodemographic maps, the London Poverty Maps were created by Charles Booth over the course of a decade in the late 19th century, exhaustively colouring each individual house in the capital, on the basis of observations of the deprivation levels of the inhabitants by him and his team of assistants. Mapping London reviewed an exhibit at the Museum of London featuring the maps, many years ago, and now a new book has just this month been published, which curates the maps, along with selected observation notebook notes and photographs of the time, into a single volume.
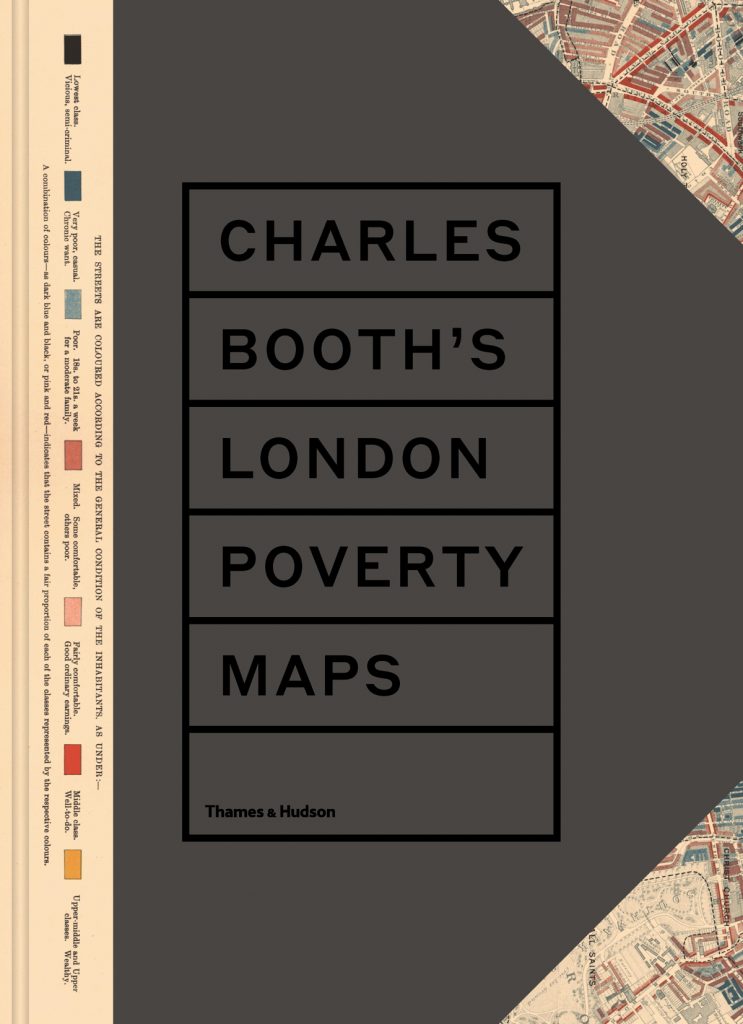
The book, now published by Thames & Hudson in association with the London School of Economics (LSE) who hold an original set of the maps and the notebooks, makes an immediate impression with its size – a two-page spread is half a metre wide, allowing high quality reproductions of the maps on the pages, with individual house detail clearly visible. The iconic key from the maps, with its striking categorisations from a more forthright time – “viscious, semi-criminal” is one of the captions – appears on the front cover.
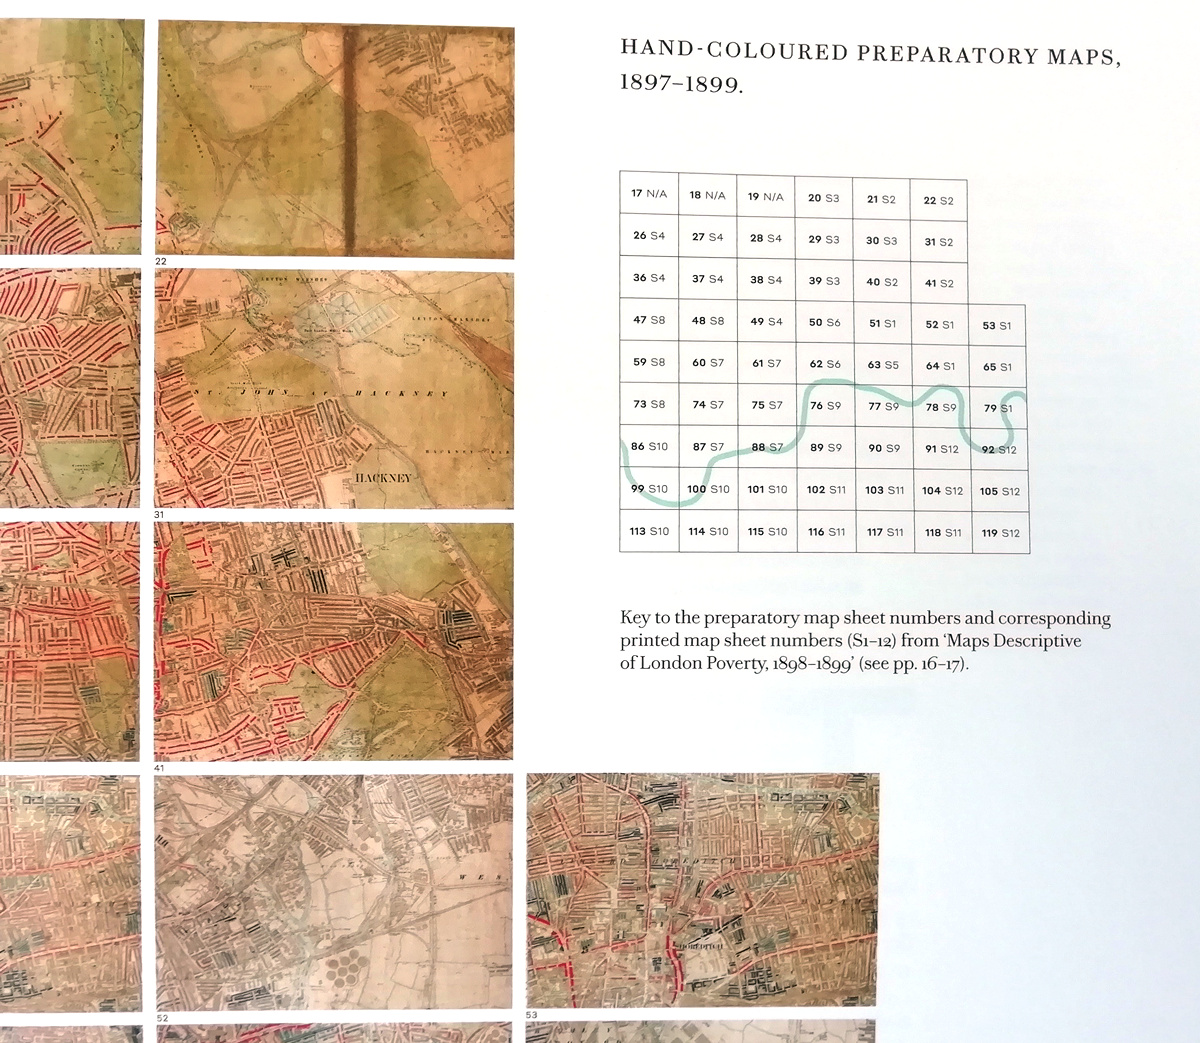
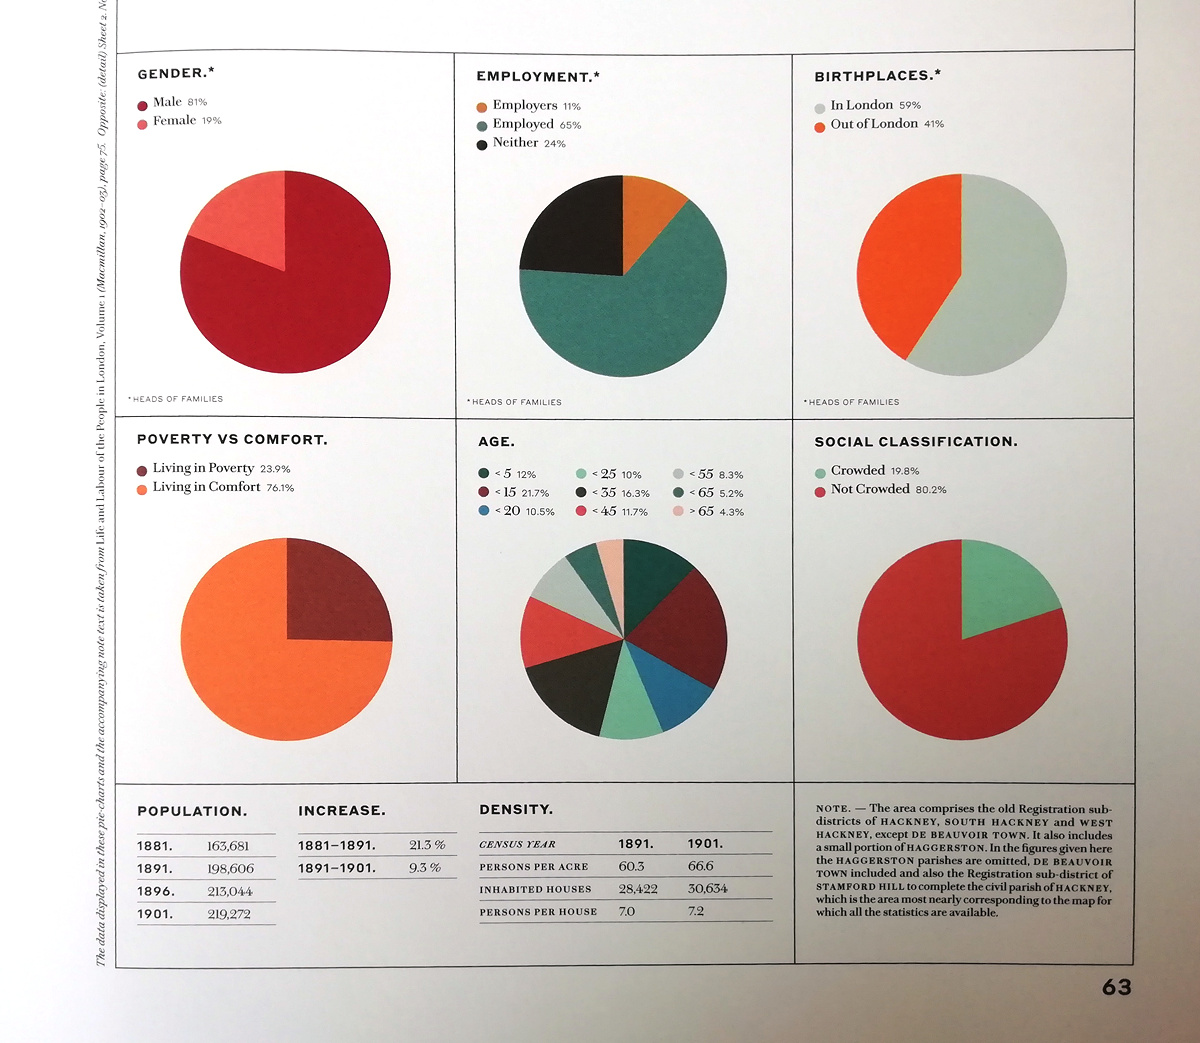
Inside, the book starts with a graphical index of the notebooks and maps it reproduces. The 12 district maps of London then are placed evenly throughout the 290 pages of the book. Each district is introduced with a simple demographic profile of the area at the time (e.g. gender ratio, age breakdown) obtained from similar historical works to the Booth project:
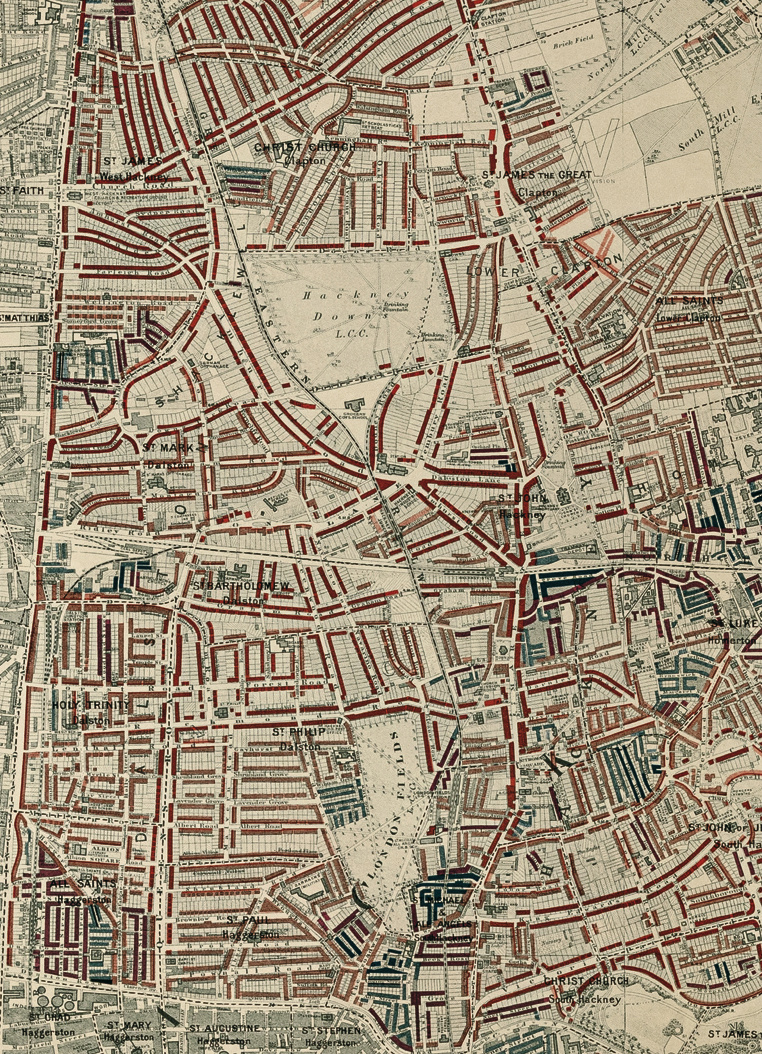
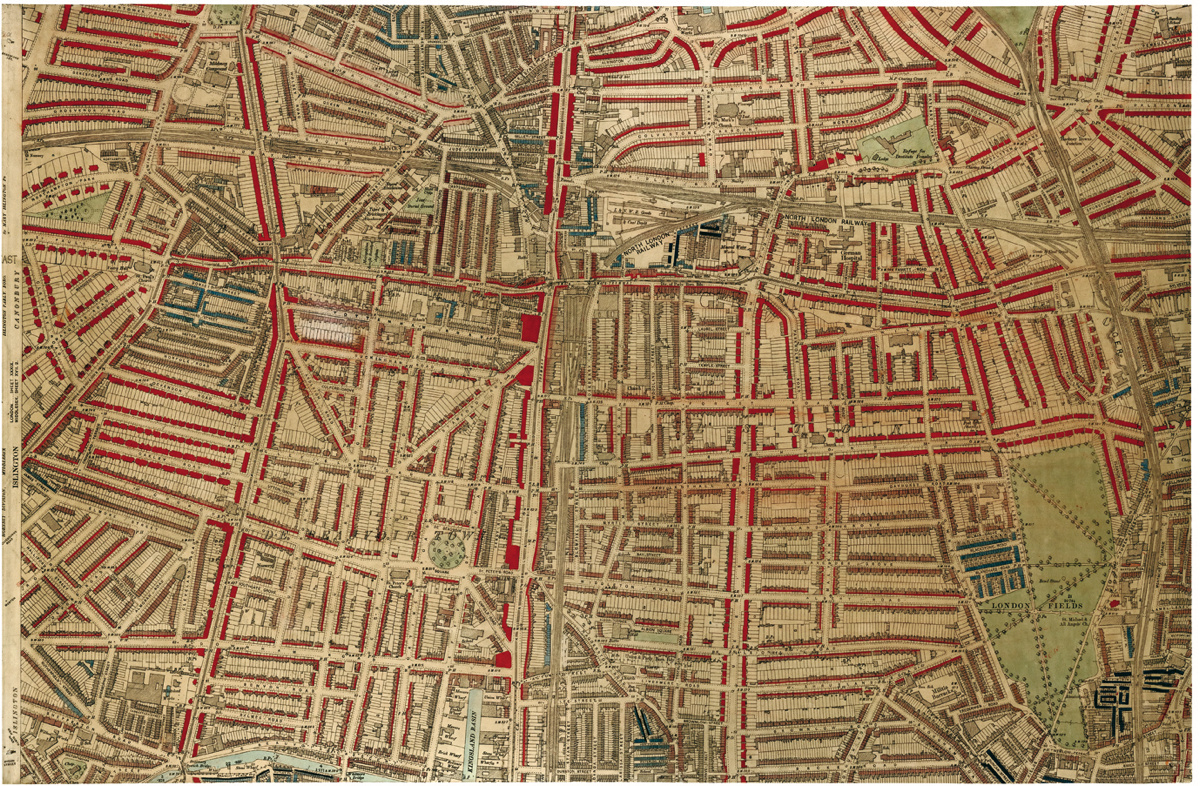
The coloured district map itself is then reproduced:
This then followed by some of the more interesting pages from the observation notebooks, and the preparatory maps used to create the classification of the area:
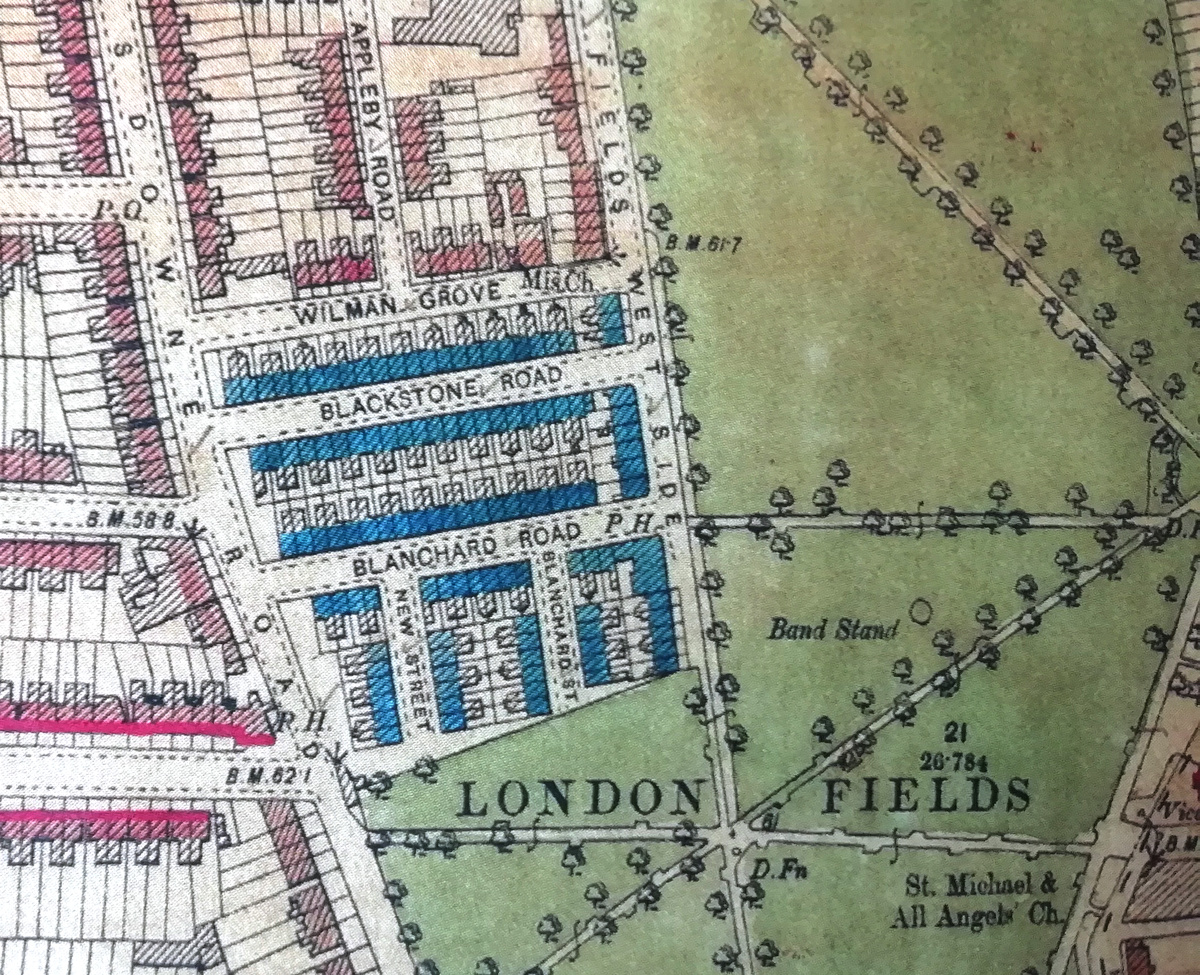
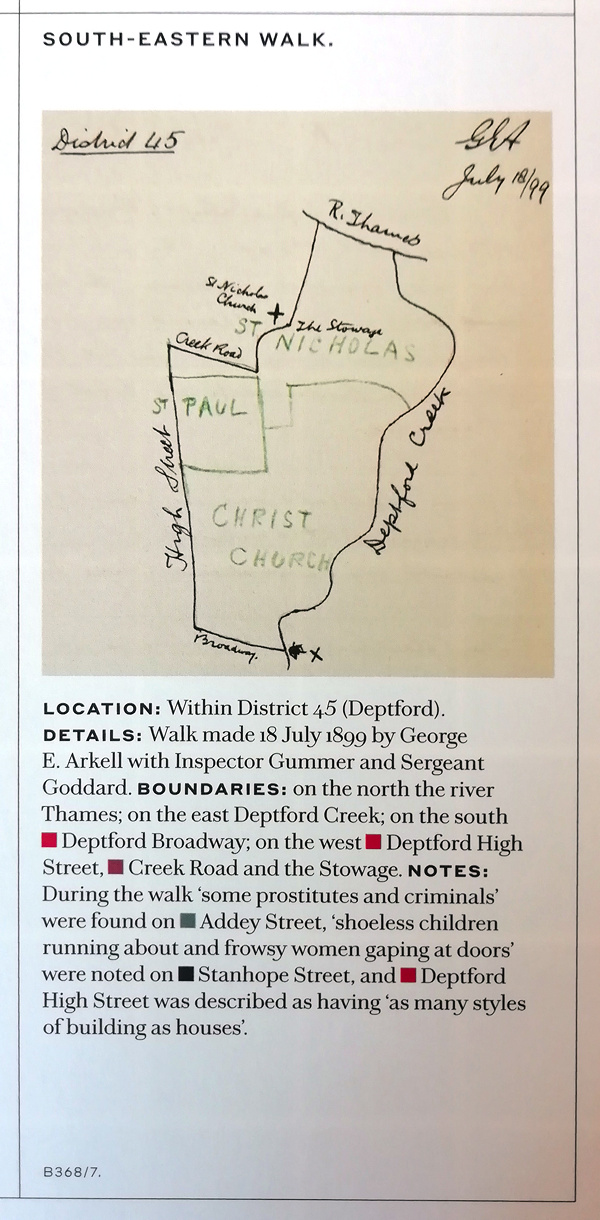
These are almost more interesting than the main map, as they are at a much higher resolution, and therefore the individual detailing is more clearly visible. Finally, an excerpt of the district map is reproduced, and annotated, with typeset version selected notebook comments. A subtle colour coding is used to link these comments with the place on the relevant preparatory map.
Also interspersed through the book are 6 sections on important themes relating to London’s population at the time, e.g. religion. Each of these thematic sections is written by a different author and typically uses other maps, printed materials and the many photographs taken by Booth’s investigators, to illustrate the theme, along with further extracts from the investigator notebooks.
Those with an interest in historic pubs of London will like the final theme, Leisure, which includes a large number of photos of the pubs – some of which have survived to this day, along with music halls and various other establishments that kept London Victorians entertained.
“Charles Booth’s London Poverty Maps” is out this month, and is available from Amazon and in all good bookstores with a London section. It has clearly been produced with care and dedication, and so is without doubt the definitive volume on these famous 120-year-old geodemographic maps and as such an essential in the collection of anyone interested in London, Victorian, historic mapping or social history.
Thank you to Thames & Hudson for a review copy of the book. The maps are from the Charles Booth Archive, courtesy of London School of Economics.
Charles Booth’s London Poverty Maps — https://t.co/f3RjfLjMlD
Charles Booth’s London Poverty #maps https://t.co/BnFEkuWU8m