Alexander Brett has created this interactive map of London using the D3 visualisation framework and its “Force Layout” view. This places the data points (London ward centroids) at their geographic origin, and then applies a series of competing forces, as if the points are connected by a mesh of springs, to subtly adjust the locations based on the data value. Alex has seeded the map with a number of socioeconomic datasets from the London Datastore. You can set two variables – one, a list of categorical measures, controls the colours, and the other, a list of qualitative measures, controls the area sizes. You then sit back and let the code do its magic, as the map warps and the circles grow and shift into their new data values.
The technique is both clever and simple at the same time – it’s a neat bit of D3.js programming, and the results are easy to interpret and navigate. It reminds me of the After the Flood cartograms, although it’s more geographically accurate. I’ve tried a similar technique for my London Election map although I’ve not allowed my circles to ebb and flow based on the data, so my data can overlap or leave empty spaces.
The code is open source so it should be straightforward for the community to adopt and enhance it. I would love to see the London Datastore use this as a “default” visualisation of their ward and borough level datasets. While a map with regular geographical features certainly has its place, sometimes stripping nearly everything away can be just as clear and informative.
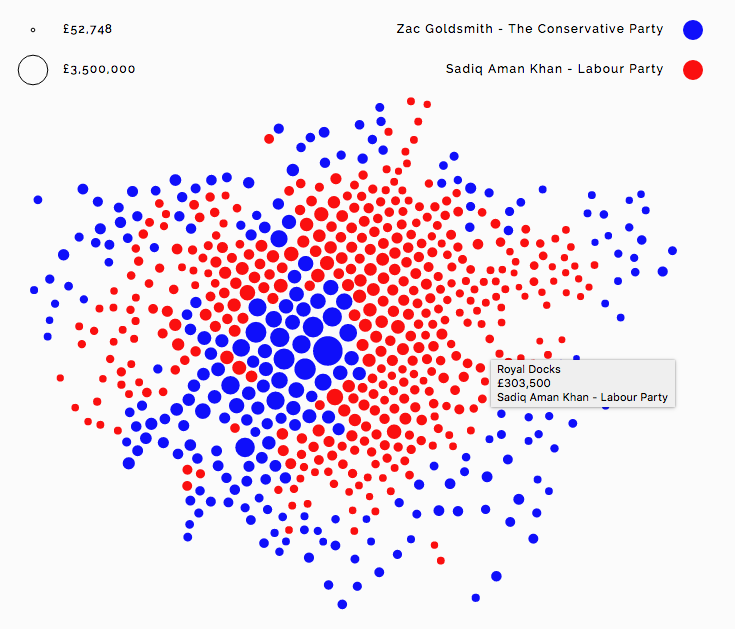
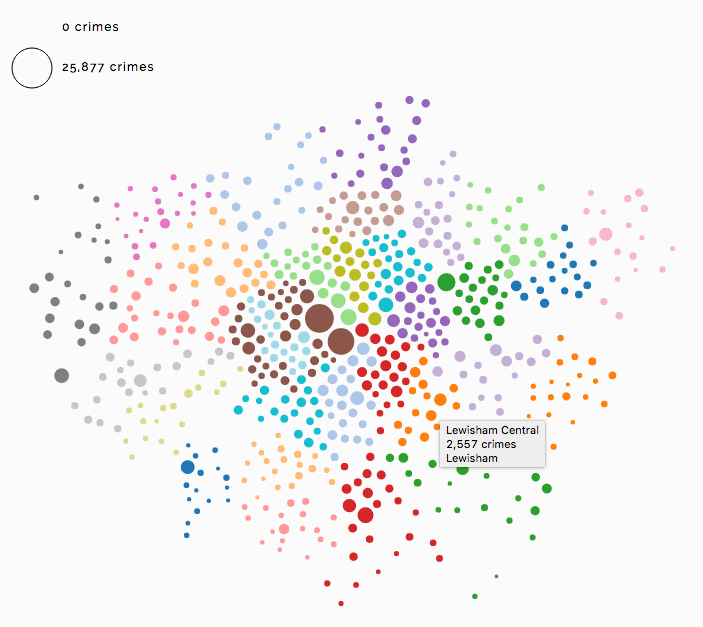
Above – crime rate for each London ward, based on crimes per resident population, 2014/15, Met Police area only. Each borough is coloured different. Westminster in the centre stands out, mainly due to the very high daytime population and much lower nighttime population. Below: Variation of median house price across London wards (2014 price paid), with the colours showing the Mayoral election result. The very high house prices of most Kensington and Chelsea’s wards cause this area to “bulge out” slightly beyond its normal geographic footprint.

Spotted on Reddit.