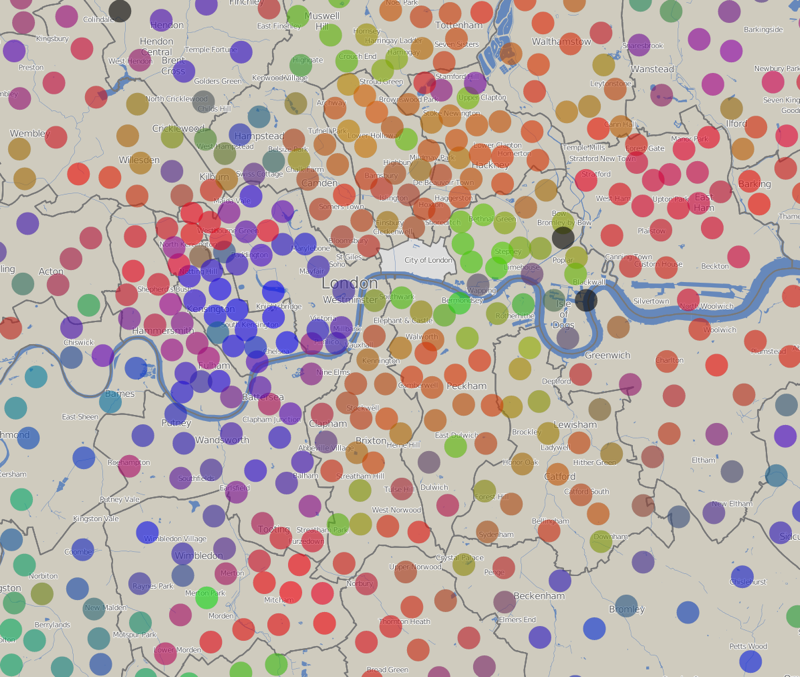

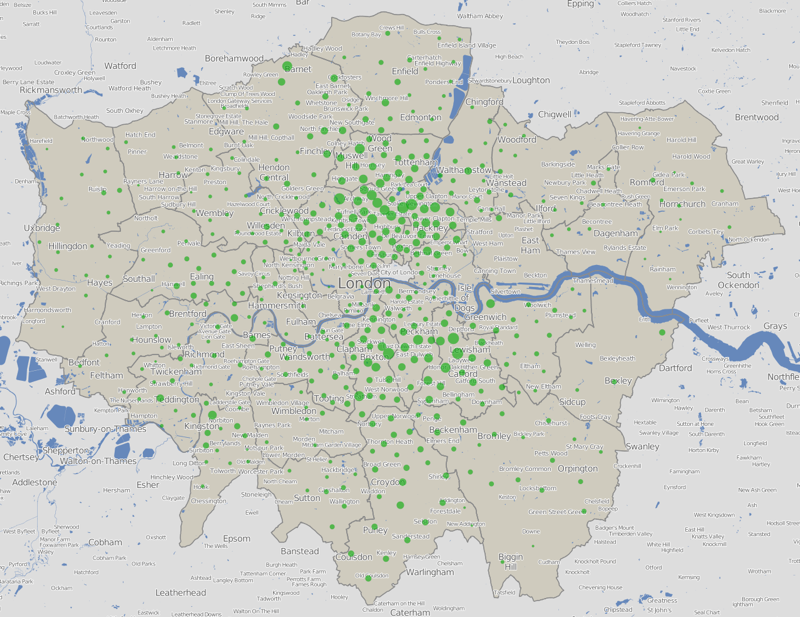
The above graph shows the results of the council elections that took place last week for each of the ~600 wards in London. The colours are derived by adding together colours for each party (Labour = red, Conservatives = blue, others = green) by the proportions of votes received, to come up with a single representative colour for the ward. More details on the technique are on my blog. There is also an interactive version of the map where you can view the equivalent map for previous years, and also focus on individual parties. Below, for example, shows where the Green Party vote was, with the sizes of the circles here being proportionate to the votes cast.
One comment