Alexander Brett has created this interactive map of London using the D3 visualisation framework and its “Force Layout” view. This places the data points (London
More...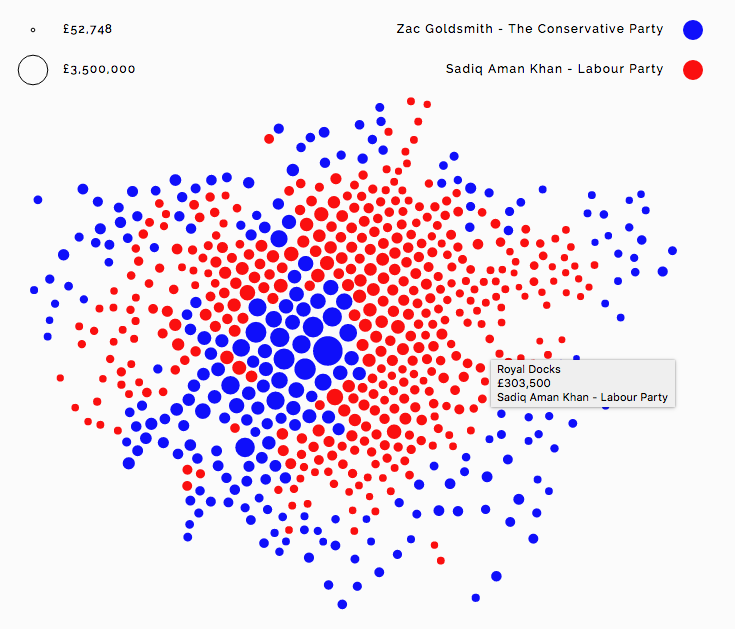
Highlighting the best London maps
Alexander Brett has created this interactive map of London using the D3 visualisation framework and its “Force Layout” view. This places the data points (London
More...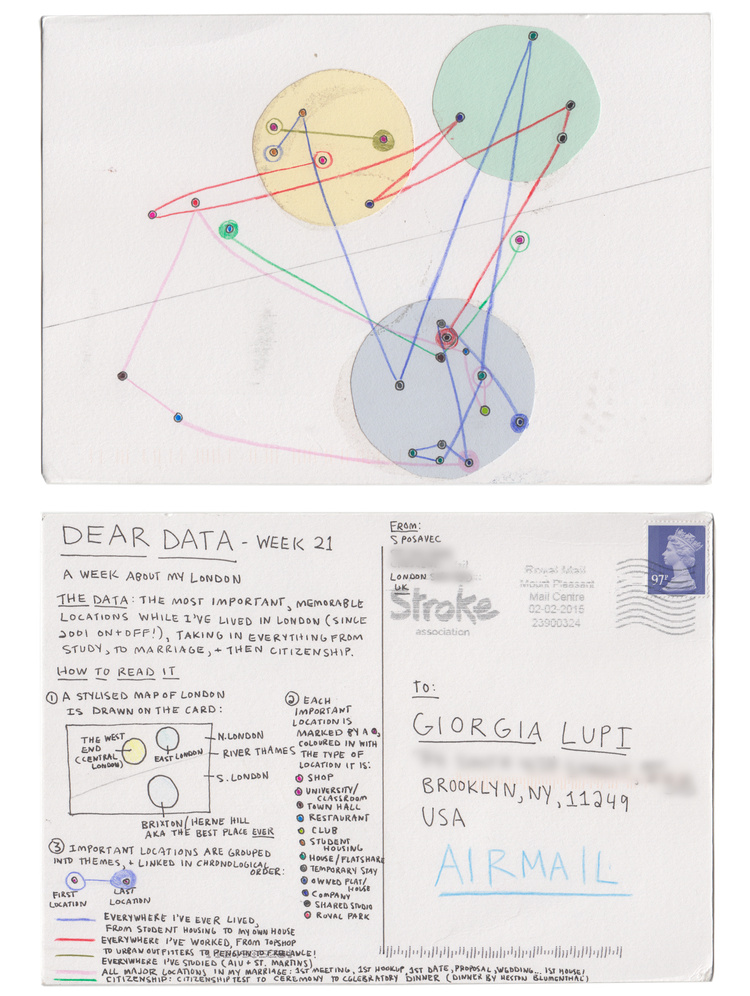
This is one of the many data visualisation and design postcards that Stefanie Posavec and Georgia Lupi sent each other of the course of a
More...
This is a cross-post from oobrien.com. Above is an excerpt of a large, coloured-dot based graphic showing the locations of street trees in Southwark Borough
More...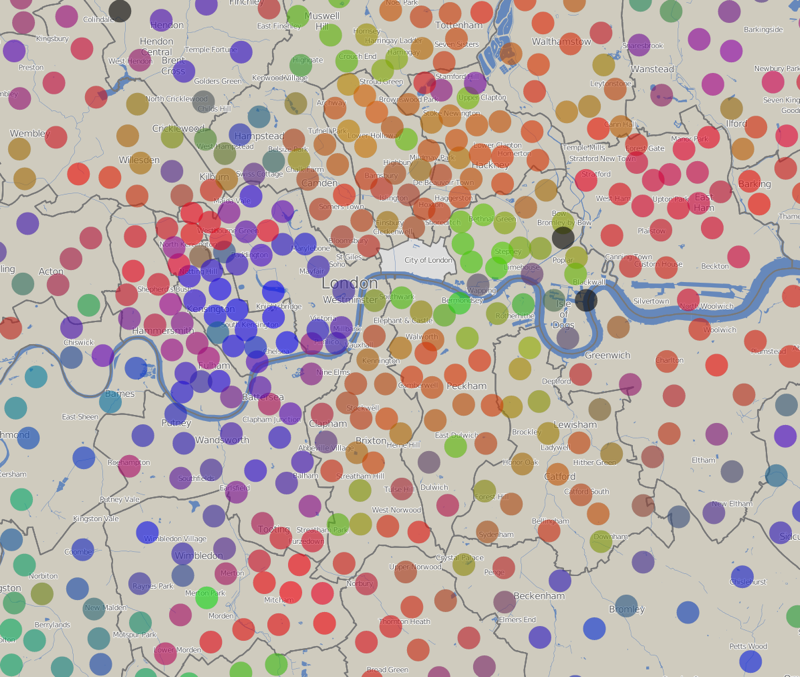
The above graph shows the results of the council elections that took place last week for each of the ~600 wards in London. The colours
More...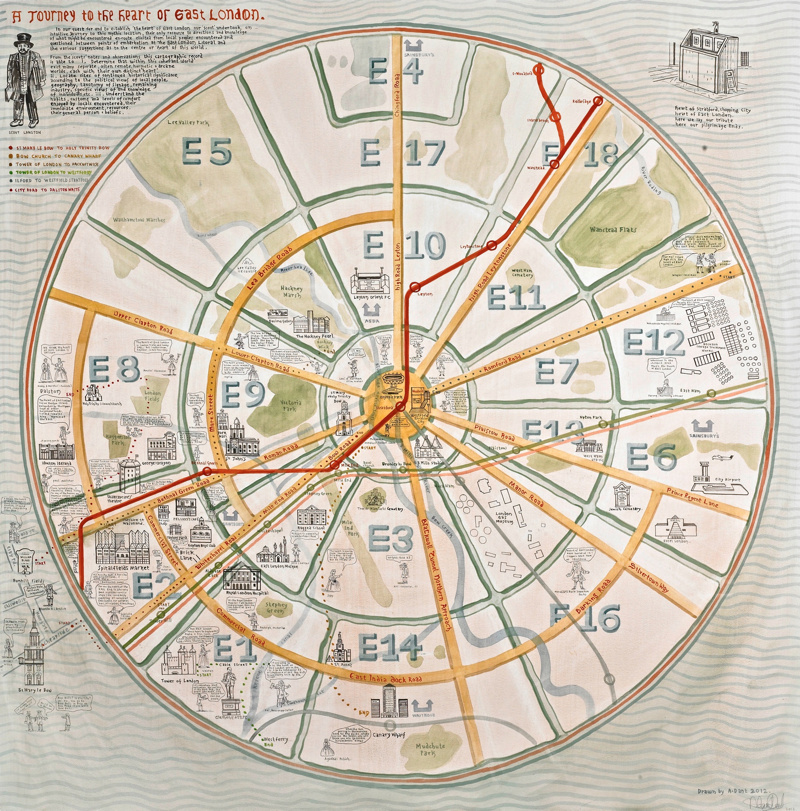
We are big fans of maps based on a circle and of Adam Dant’s work so this map, which combines the two, is a real
More...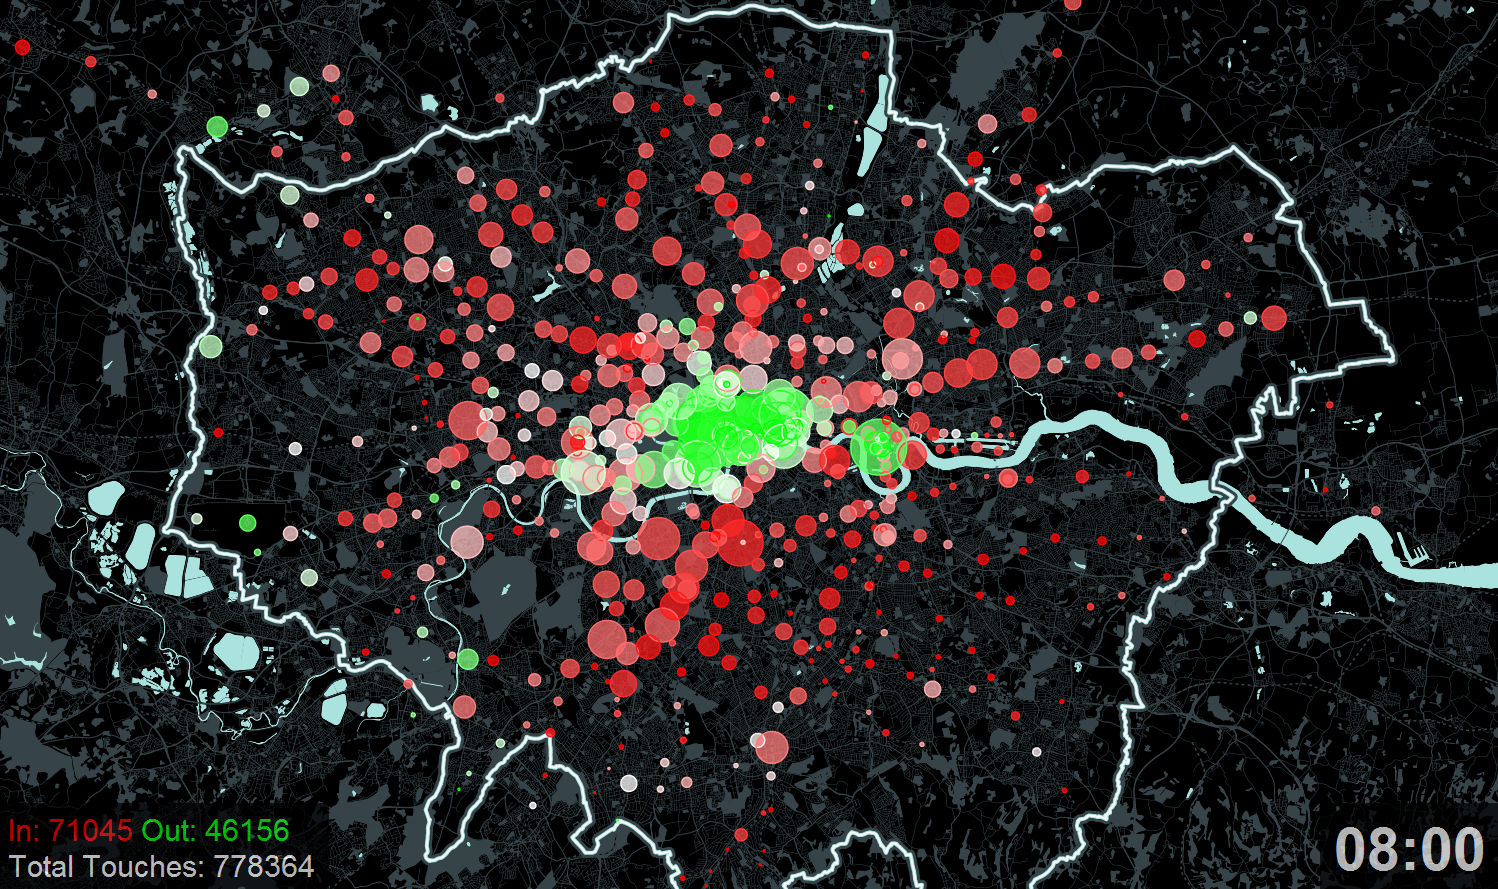
A new exhibition – Sense and the City – opens today at the Transport Museum in Covent Garden. It includes a number of transport data
More...