Mapping London’s co-founder and “Editor at Large” Dr James Cheshire co-produced “London: The Information Capital” with Oliver Uberti in 2014. We mentioned the book on its initial release. The book has this month has now been published in a softback edition by Penguin, with some minor corrections applied. If you missed out on the book the first time, this is therefore an ideal opportunity to pick it up (e.g. here on Amazon) at a new, low price. The book, containing over 100 data maps and graphics, visualises London, its people and its data.

The book runs to nearly 200 pages and every map style is different – many techniques have been employed, each aiming to best show its dataset in an original and eye-catching way. Some of my favourites are:
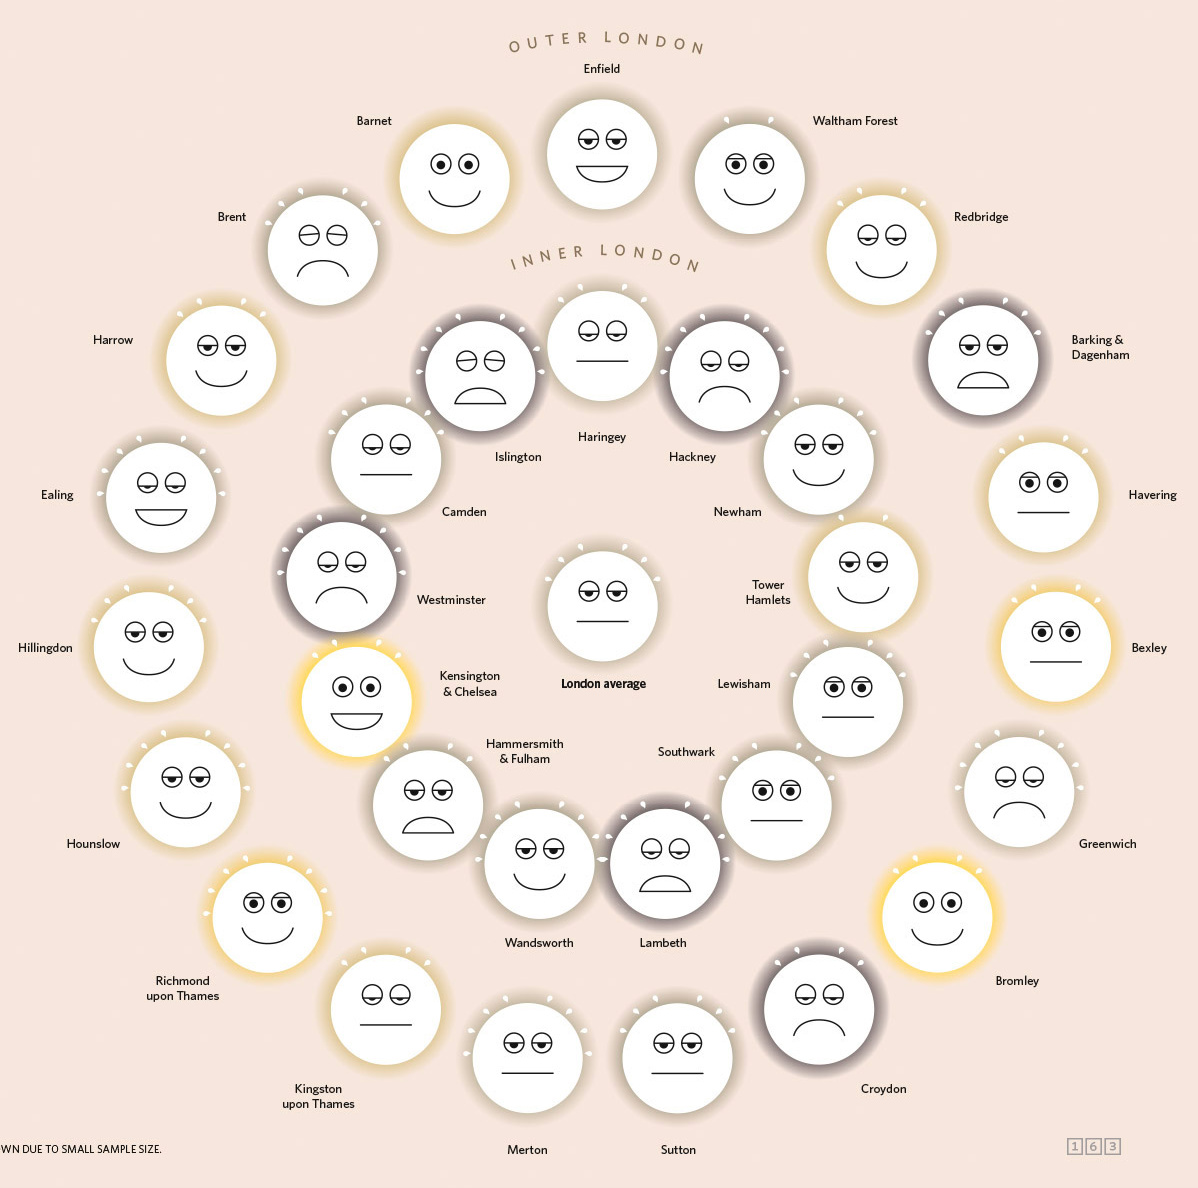
- Islington has Issues. This graphic (above, also see full online version) uses glyphs to represent each borough as a face, with the mouth, eyes, eyebrows, perspiration and general “glow” varying according to four measures of well-being. The graphic is also a map – the glyphs are arranged in three concentric circles, the innermost being an average and the middle and outer rings representing inner and outer London respectively. The boroughs are arranged approximately relative to each other in geographical space. This technique has been used in hexagonal and square forms before and I think it’s an effective way of simplifying borough boundaries (which are largely unfamiliar to most people) while preserving borough separations to show a changing picture across the capital. A single futher glyph represents the rest of the UK, showing that Londoners are generally unhappier than most.
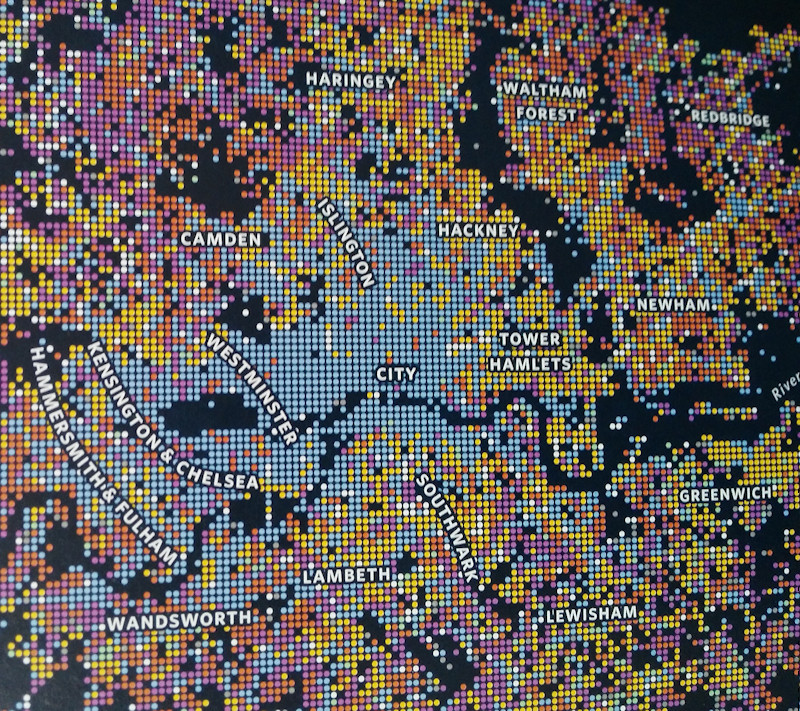
- Top Crimes. The Met Police release the approximate locations and category of all crime reports in London. Crunching this data can derive information showing the most common crime type in each each area. This can be gridded to produce this compelling map (see top) in The Information Capital. Central London’s pickpockets light up the Westminster and City areas, the inner city shows violent crime, and vehicle crime, while further out in the suburbs burglary is the main crime suffered by the residents there. Note that this is a map of top crime type – not volume (see this one), so is does not distinguish between high-crime and low-crime areas. However some areas, that suffer very little crime, do appear blank in the map, due to the lack of substantive data. Nothing bad ever happens in Richmond Park – or, more likely, the crimes here are coded to a populated area on its edge.
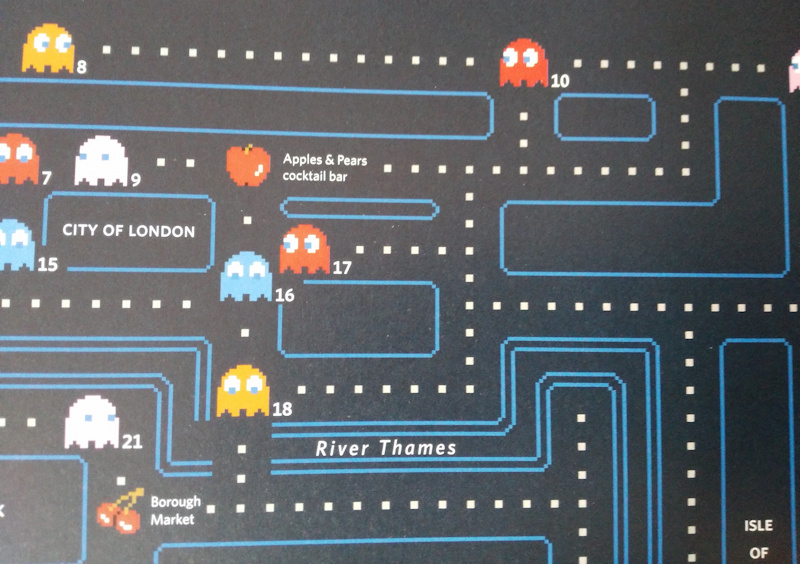
- Ghosts of London Past. Finally, this work (extract below) created for the book by Londonist editor Matt Brown, takes London ghost stories and positions them on a Pac-man-esqe map of central London, with each ghost representing the location of a supposed haunting. One of the 26 stories is completely made up, the others are “true” tales. I like the way the wiggles of the Thames fit well into the Pac-man board. Trivia, such as the location of the world’s largest Pac-man game, is also included. It’s not the first time there’s been a London Pac-man board incidentally, Google perhaps spotted the work, or had the same great idea, as as they included one in their April Fools map last year.
- Tube Challenge. See our review here.
London: The Information Capital has excellent production values – every map, crucially, is clear and crisp, with minute detail often visible. Thorough fact checking and appropriate academic rigour and analysis applied to the data means that there can be confidence in the fair representation of the diverse data source that make London such a fascinating city to study. The data maps are balanced out by some illustrations from co-author Oliver Uberti, who included sketches of the many weird and wonderful animals of London Zoo, and legally protected London views, for example.
The new soft-back edition is published by Penguin and is currently available from Amazon for £11.99 (list price £14.99). Considering over a hundred maps and graphics are included, this is a bargain price for a book where every page reveals something new. Thanks to James for a review copy.

The maps and graphics are copyright the authors Dr James Cheshire and Oliver Uberti, and/or their producers.

RT @MapLondon: Review of “London: The Information Capital”, a visual guide to London data, newly published in softback by Penguin: https://…
RT @MapLondon: Review of “London: The Information Capital”, a visual guide to London data, newly published in softback by Penguin: https://…
RT @oobr: Review of “London: The Information Capital”, a visual guide to London data, newly published in softback by Penguin: https://t.co/…
RT @oobr: Review of “London: The Information Capital”, a visual guide to London data, newly published in softback by Penguin: https://t.co/…
RT @oobr: Review of “London: The Information Capital”, a visual guide to London data, newly published in softback by Penguin: https://t.co/…
RT @MapLondon: Review of “London: The Information Capital”, a visual guide to London data, newly published in softback by Penguin: https://…
RT @MapLondon: Review of “London: The Information Capital”, a visual guide to London data, newly published in softback by Penguin: https://…
RT @MapLondon: Review of “London: The Information Capital”, a visual guide to London data, newly published in softback by Penguin: https://…
RT @MapLondon: Review of “London: The Information Capital”, a visual guide to London data, newly published in softback by Penguin: https://…
RT @oobr: Review of “London: The Information Capital”, a visual guide to London data, newly published in softback by Penguin: https://t.co/…
Sorry wrong email