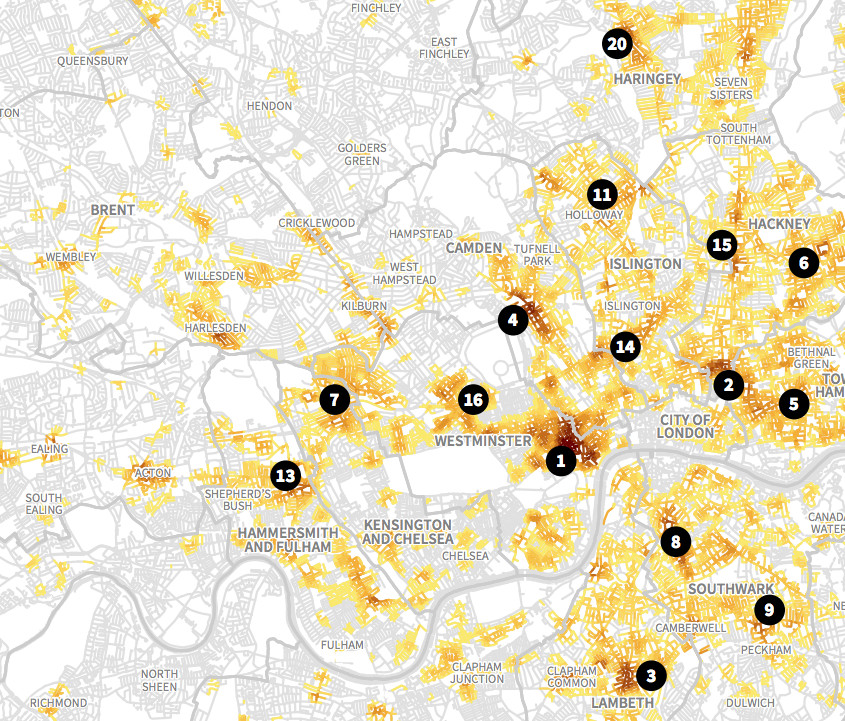

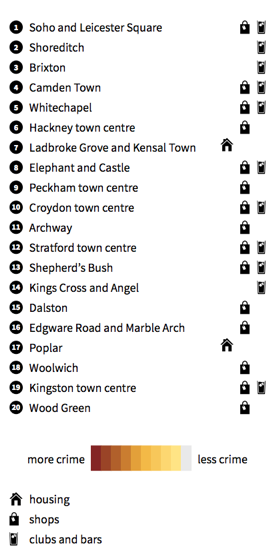
This is an extract of a map, by Matt Ashby, formerly of the UCL SECReT (Security and Crime Science) lab, that takes police.uk open data on crime locations, analyses and filters the data for hotspots, and shows the concentrated areas of crime by colouring in a road network map sourced from Ordnance Survey open data.
 The cartography of the map is clear and attractive, and the visualisation is a great example of “less is more” – by filtering and removing the “noise” (crimes of all sorts happen across London but that doesn’t mean everywhere is in the grip of a crimewave) it allows the significant results to stand out.
The full map is available to download as an A0 PDF from this blog post which also highlights some of the interesting patterns in the data, such as crime along the long traditional high streets of London.
Matt also produces Crime in London [Update – site closed] which provides a clear and simple way of displaying up-to-date police.uk data, for each borough and ward in the capital, including trend information, local hotspots, and detail on the individual crime categories. Headlines are automatically generated which present the most pertinent information. It’s one of the clearest and most informative websites I’ve seen for a while and an excellent example of combining statistical and geographical open data sources with sensible simplification and good web design, to create a compelling and informative website. As well as the crime-specific information, neighbourhood profiles are also available at ward level, pulling in census, land cover and other information, including Geograph photos.
Matt continues to update his blog with crime data-related research, you can read the latest posts here.
The map is CC-By Matt Ashby who is @lesscrime on Twitter.
One comment