
London has been home to many great cartographers and has been the subject of many stunning maps that depict all aspects of life in the city. Drawing inspiration from these and capitalising on the huge volumes of data now available, I have spent the past year working with designer Oliver Uberti to create a collection of maps and graphics entitled London: The Information Capital. We asked ourselves questions such as
Which borough of London is the happiest?
Where are the city’s tweeting hot spots?
How many animals does the fire brigade save each year?
Which London residents have left their mark on history?
Where are London’s most haunted houses (and pubs)?
What makes London the information capital?
and sought to answer them through data visualisation. The book contains over 100 full-colour spreads alongside some brief essays to introduce each of the 5 broad themes – Where we are, Who we are, Where we go, How we’re doing and What we like.
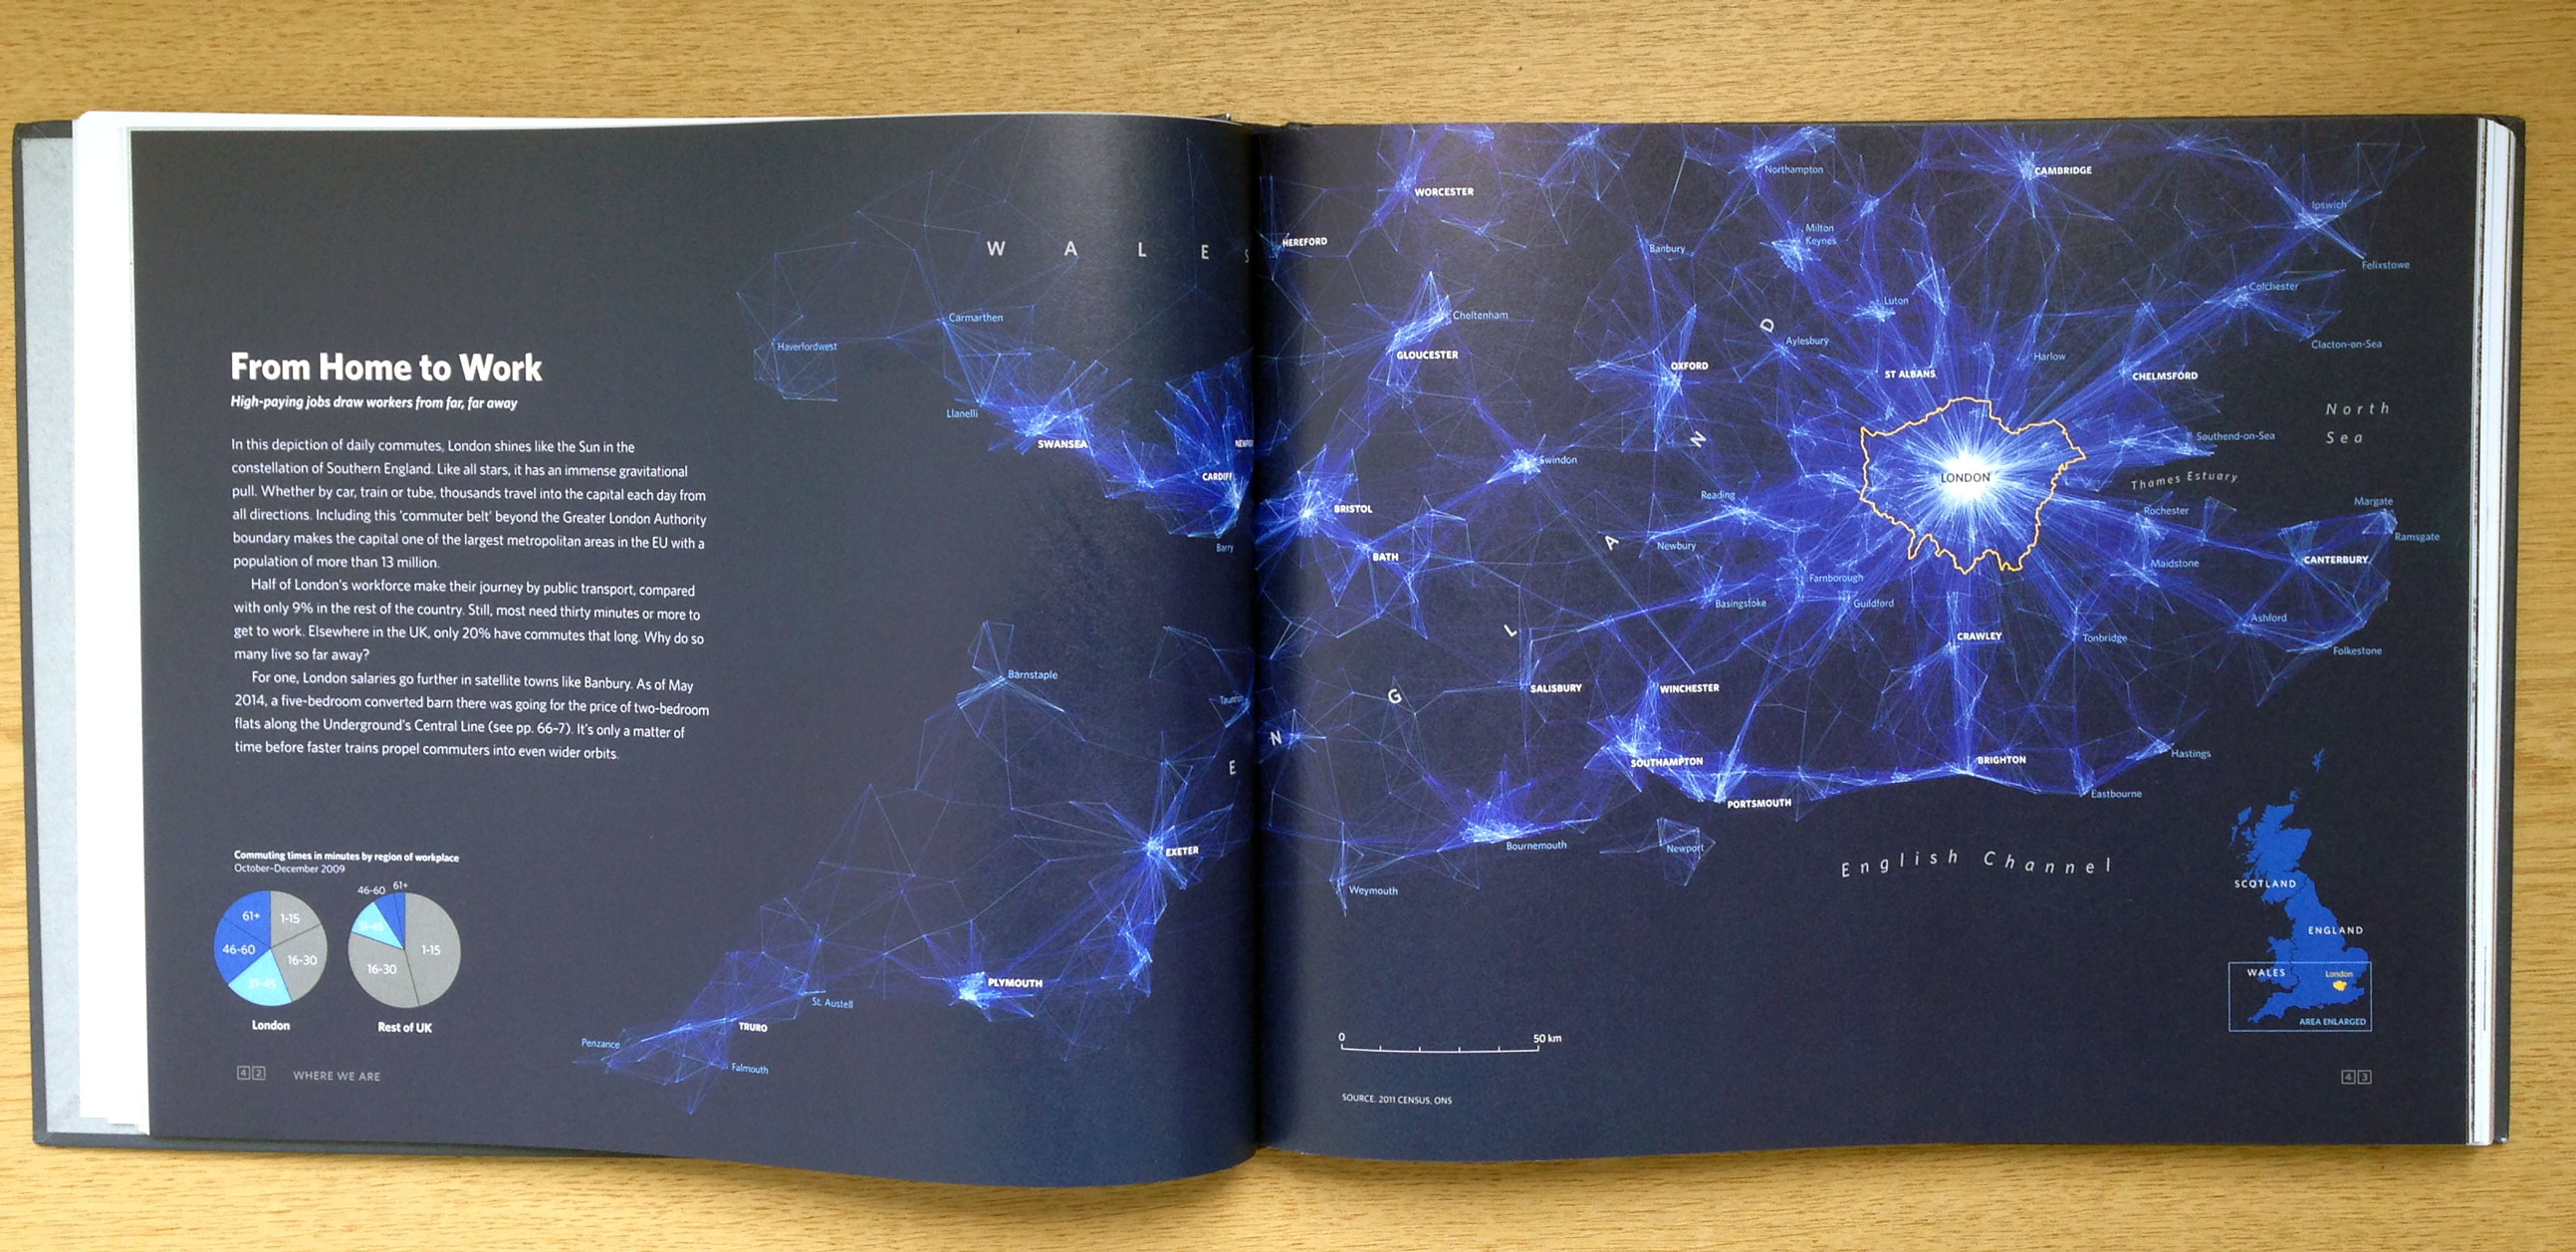
Oliver Uberti and I worked closely with our publisher Particular Books (part of Penguin) to create a book that was a beautiful as it could be. Inside you’ll find some graphics with transparent overlays for before/ after comparisons, binding that minimises the impact of the centre fold and page dimensions tailored to the shape of London. All this showcases everything from watercolours of London’s protected vistas, 24 hours of shipping in the Thames Estuary and London’s data DNA. You can find out more here or pick up a copy on Amazon now or in all good bookshops from the 30th.
There are also a couple events taking place to mark the launch of the book. Find out more here.
London is a Great City, Thanks for Providing such an awesome guide to london.