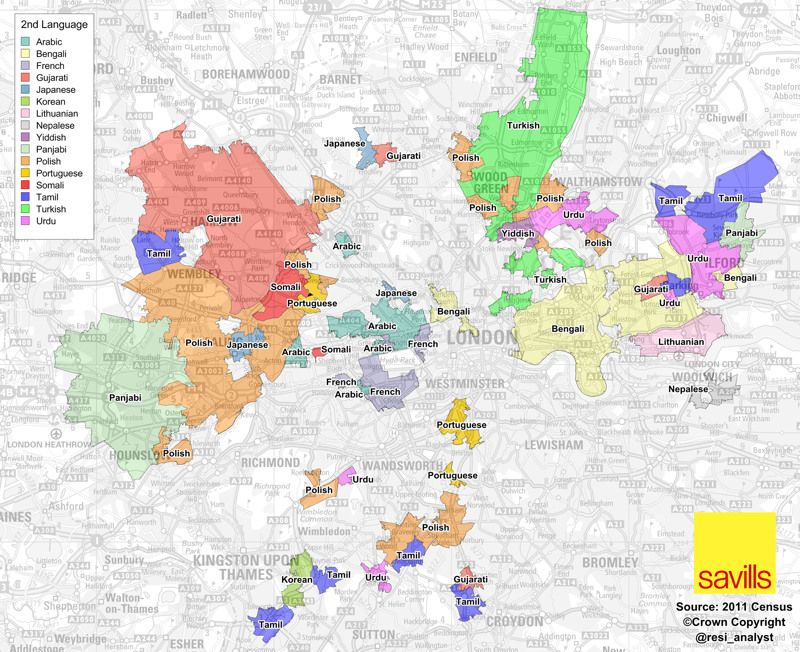

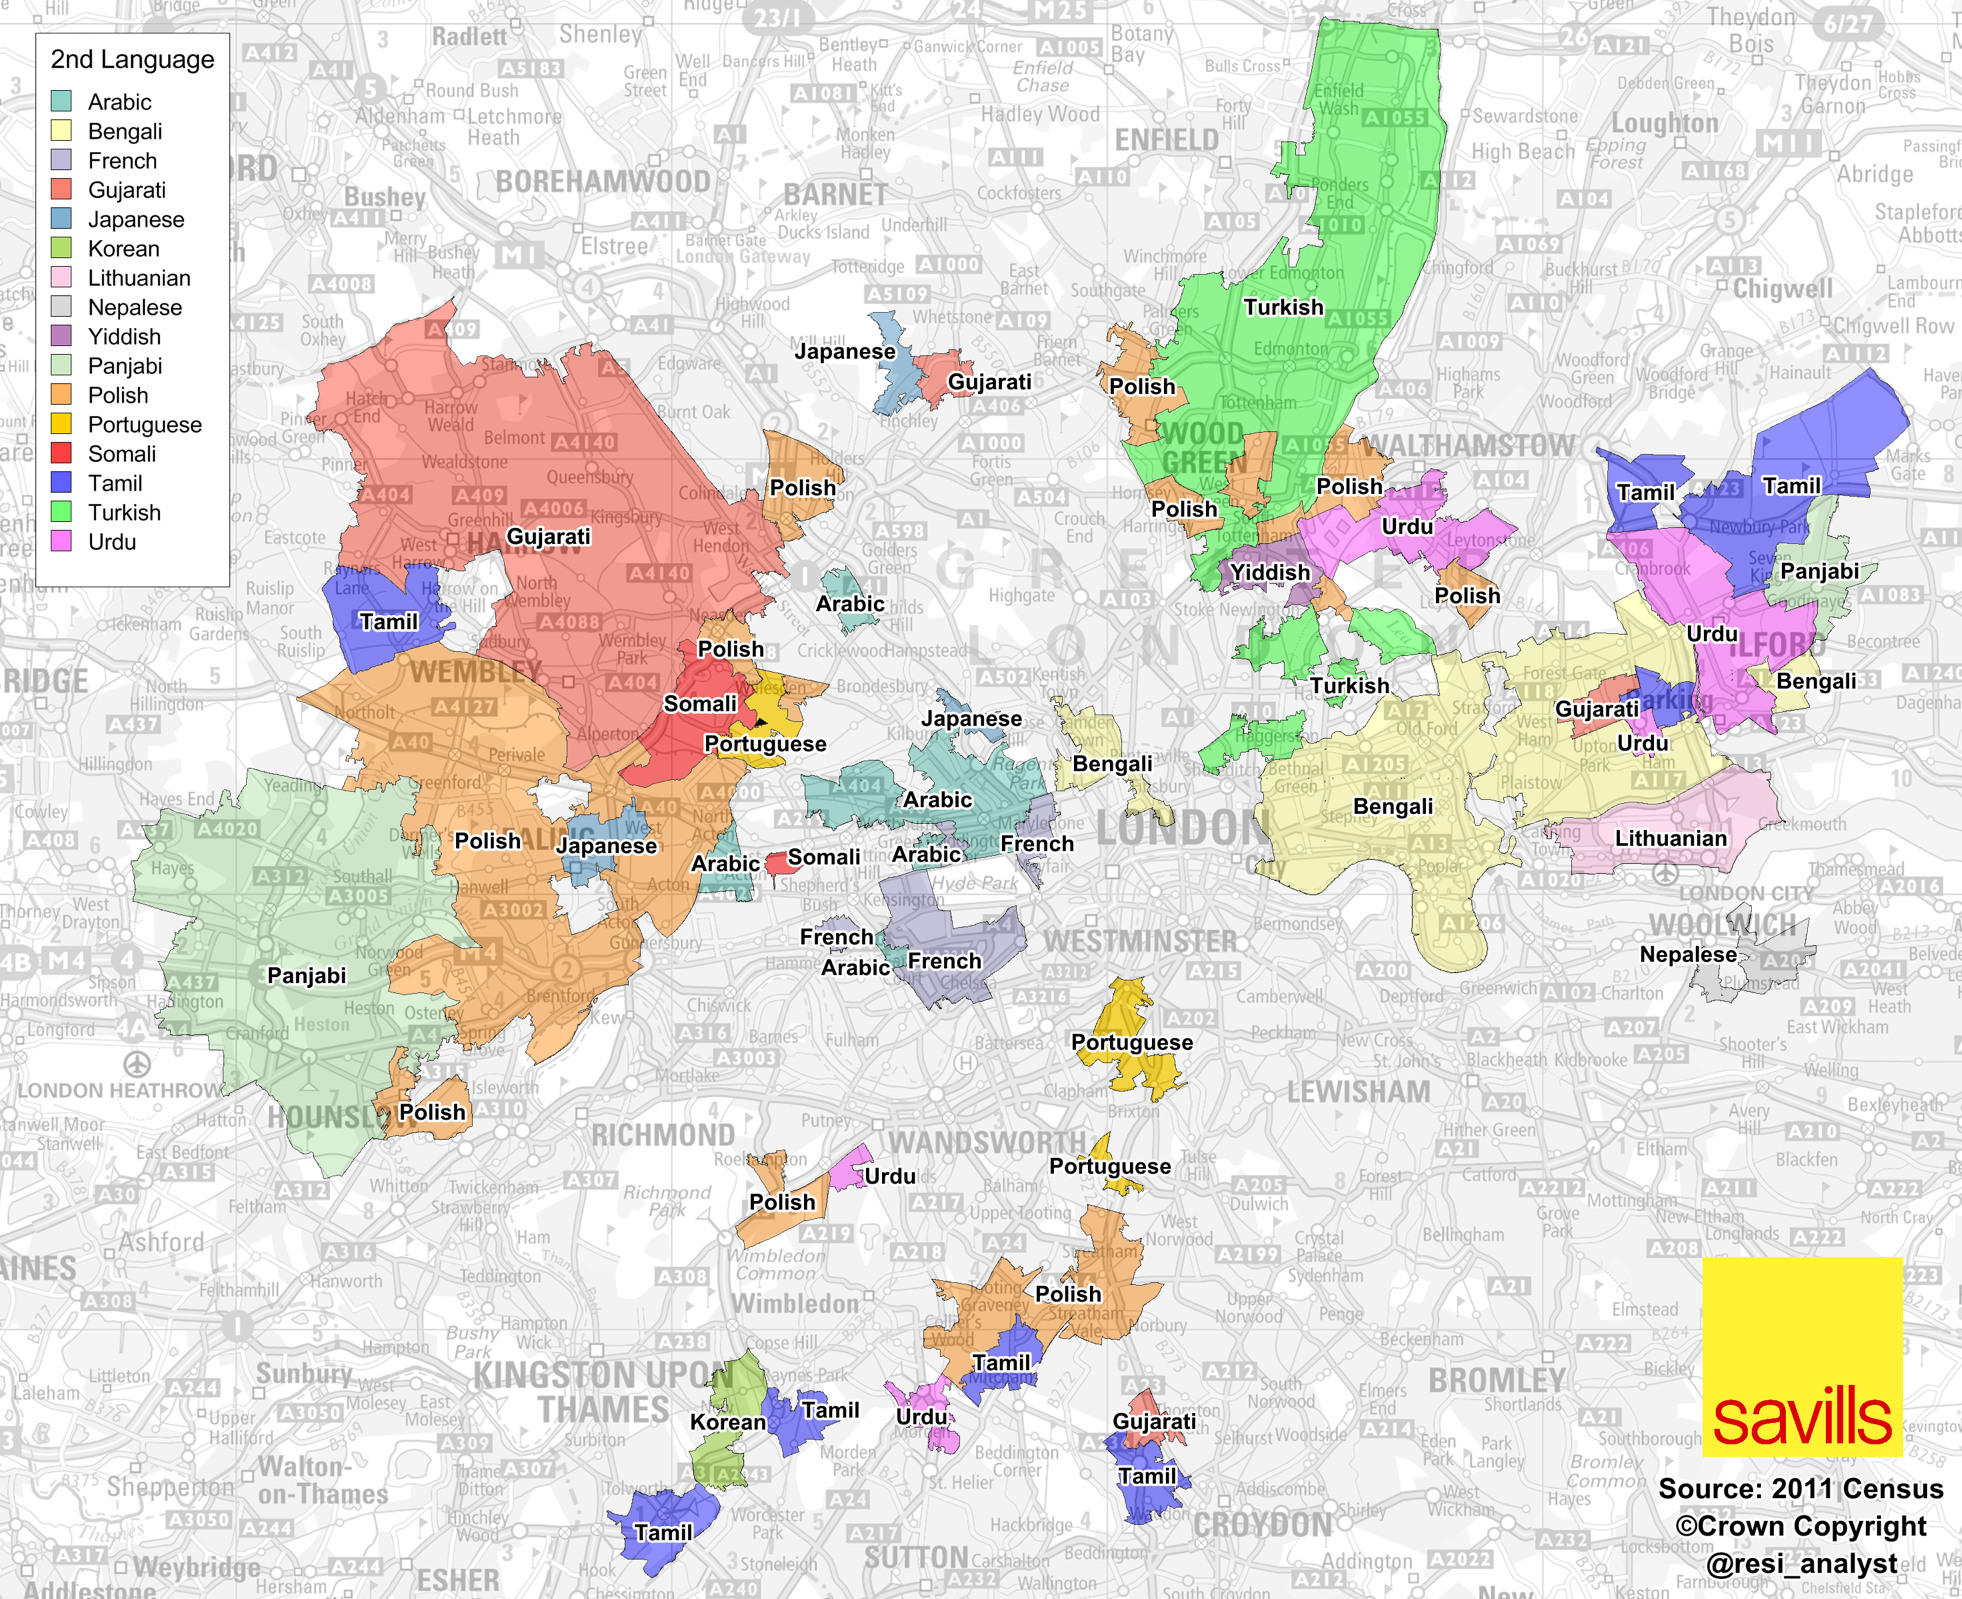
A map full of striking patterns, from Savills’ analyst Neal Hudson. It shows the areas of London where, for each area, the second most popular language is spoken by more than 5% of residents there, based on the 2011 Census. It clearly reveals London’s linguistic clusters, from Arabic to Yiddish and Lithuanian to Tamil.
The full-size map is no longer on Neal’s website but you can download it here.
Note that this is not a map of people’s own second languages, but rather of the second most popular language spoken in each area. The areas used are Middle Super Output Areas which have a typical population of around 10000 people, so, as a guide at least 500 people within each area speak the language shown as their primary language. Middle Super Output Areas are a statistical grouping of areas. They are somewhat analogous to political wards, except that they change if their populations decrease below, or increase above, thresholds, whereas wards tend to remain constant.
Thanks to Neal for creating this map and allowing us to host it here. See also Tube Tongues and Ward Words
There is a lack of African/black presence on this map. What about the Nigerians, Somalians,Ghanians are you trying to erase them.? This map is not well done and seems UNFAIR. There are people who don’t appear to exist on your map. Can you please adjust it.
Hi Lola – the map, which was not produced by us, is a map of languages spoken, not of ethnicities or countries of origin. A similar map of the latter would likely reveal some of the groups you mention. The underlying data is based on the 2011 Census aggregate results, which include imputed results for missing returns, so is likely an accurate snapshot as you can get.
One other thing to note is that it’s possible that there are some languages, spoken by more than 5% of people in each area, which don’t appear on the map – because the result is “hidden” by another language in the same area.
Good response Ollie. Lola – I don’t know where you are from or how much you know about the linguistic make-up of the countries you mention but there are many languages spoken in Nigeria and Ghana. See this as an example: http://upload.wikimedia.org/wikipedia/commons/e/e2/Nigeria_Benin_Cameroon_languages.png
Somali is represented on the map and Arabic is also spoken in Somalia. If you look around west london you will see a lot of both.
I wonder if the title should read ‘First languages’ or ‘Native Languages’ spoken? In this case English is the second language. Great map though.
Where is Spanish and Italian? I know for a fact that their is a very large Spanish community in West London.
Likely the populations are dispersed over a wider area so falls below the 5% threshold, rather than concentrated in a small area and so likely to show up on this map.
@ Lola, @Alistair; I think this map is generated by the types of answers given by respondents during enumeration. You will find out that Africans/Blacks are actually represented by English, French, Arabic and most specifically, Somali. The map also seem to represent areas where these speakers are concentrated and other Africans that speak other Languages are rather scattered around London unlike Indians, West Indians, or even Somalis.
Theses settlement patterns are factored by the individual migration history of each of these groups int the UK.
Very useful. As people say it does not of course show ethnic mix. In Nigeria 300 languages are spoken and English is the common tongue for many who then move to London.
Harrow where I live is 64% black and ethnic minority shows up a lot of Tamils on the West and Gujarati on the East.
The number of second generation Indians and Pakistanis a good few of which only speak English at home would not show up (25% of the borough is Hindu) never mind the huge Jewish population who usually speak English at home but go to Hebrew class.
Even so it is a useful resource.
Mapping second #languages in #London | Tube #map via @CreativeReview – https://t.co/66Va51u0Oq | Area map: https://t.co/8WN5Yf185J
“The areas of #London where, for each area, the 2nd most popular #language is spoken by +than 5% of residents there… https://t.co/UwSPCmhayK