I’m a sucker for alternative maps of the London Underground, and here’s a great one by Francisco Dans (see the original in high-resolution on Flickr)
More...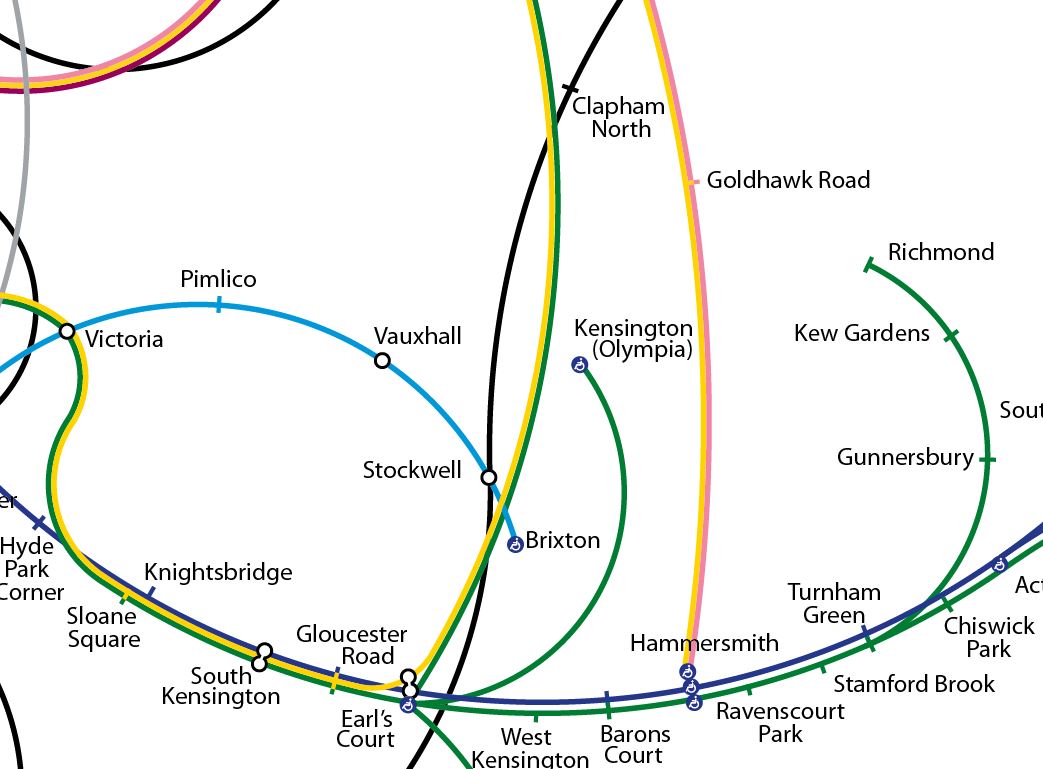
Highlighting the best London maps
I’m a sucker for alternative maps of the London Underground, and here’s a great one by Francisco Dans (see the original in high-resolution on Flickr)
More...
This week, thousands of teenagers across the capital will receive GCSE results that will likely have an impact on the life decisions they take over the
More...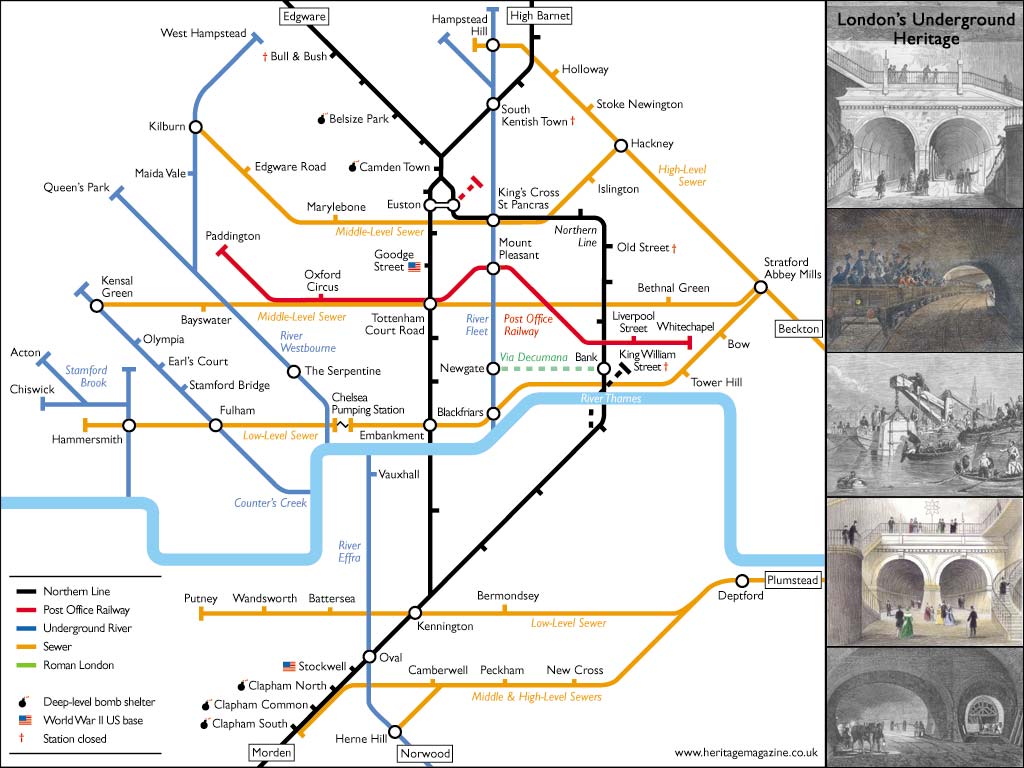
Aside from the odd rumble of a tube train, or perhaps a burst pipe in winter, Londoners often overlook the goings on beneath their feet.
More...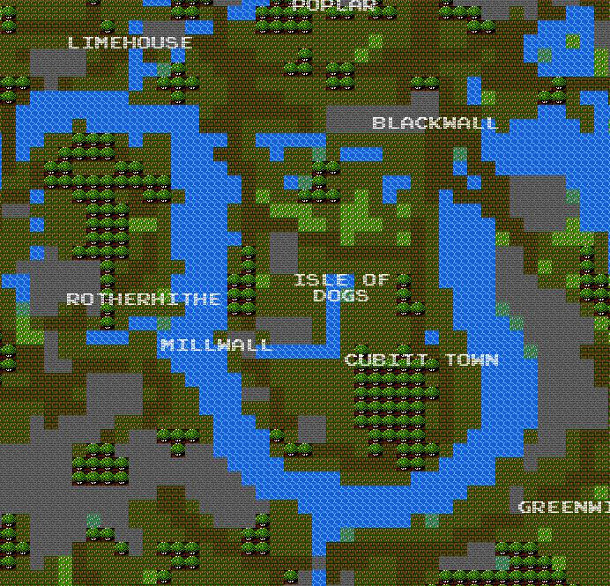
It’s a bit silly, and not exactly very helpful as a map for navigation – but it’s also a lot of fun. Brett Camper has
More...
The “Beck” London Underground map is probably the most iconic and recognisable map of London in the world. As such, it is a favourite for
More...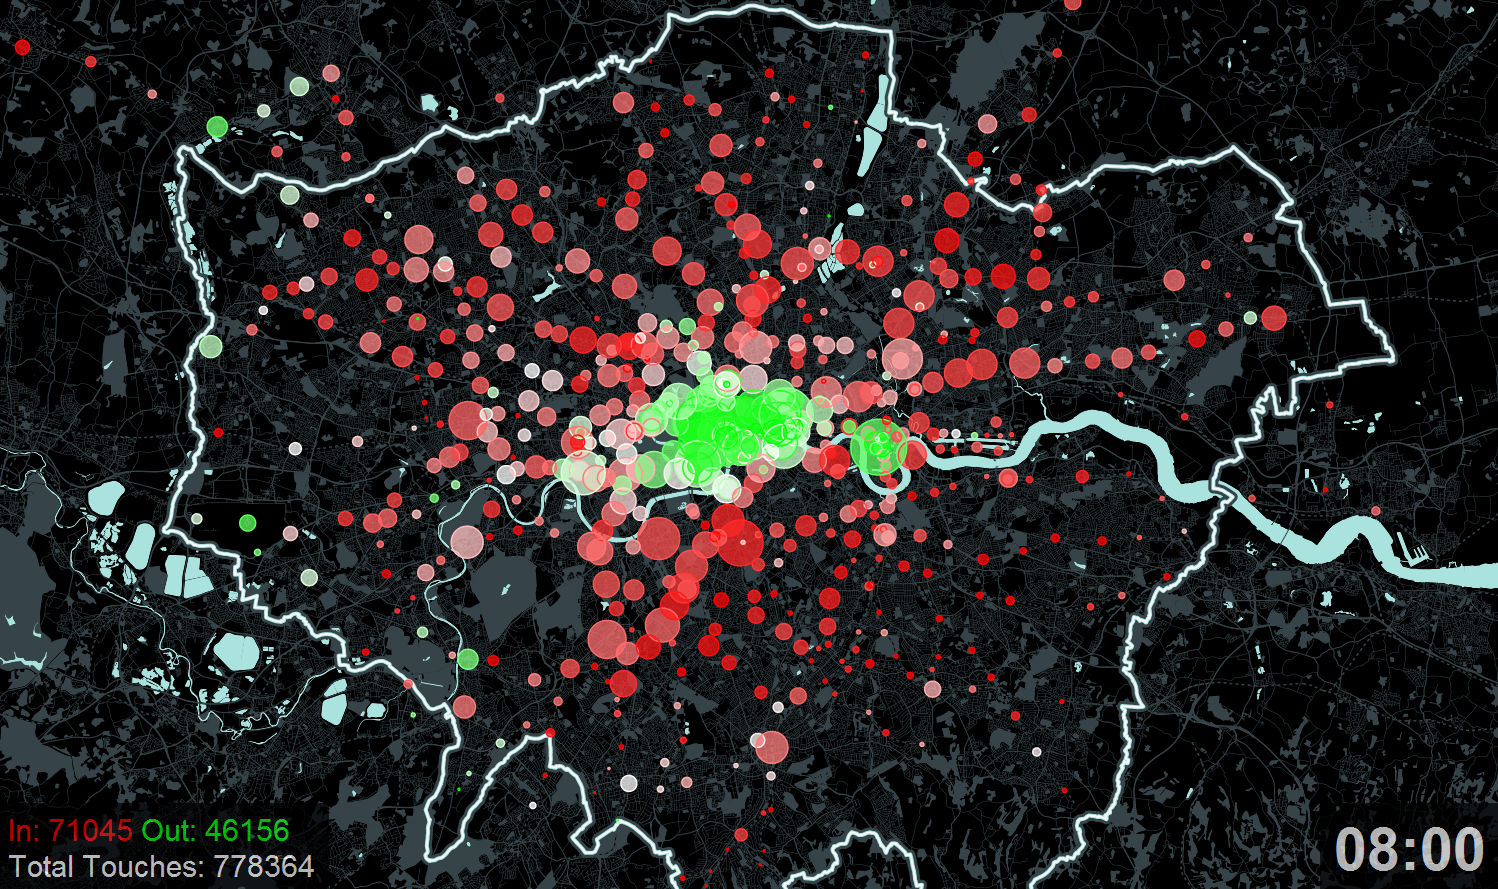
A new exhibition – Sense and the City – opens today at the Transport Museum in Covent Garden. It includes a number of transport data
More...
From Daniela Krug and Lars Malmqvist comes TubeViz – a nice visualisation of passenger entries to, and exits from, tube stations (not Overground or DLR)
More...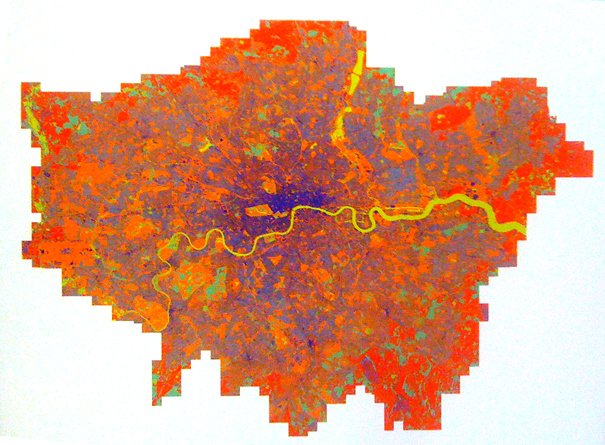
This map of mobile phone signal strength, produced by the GeoInformation Group this year, was one of the graphics featured in the exhibition that accompanied
More...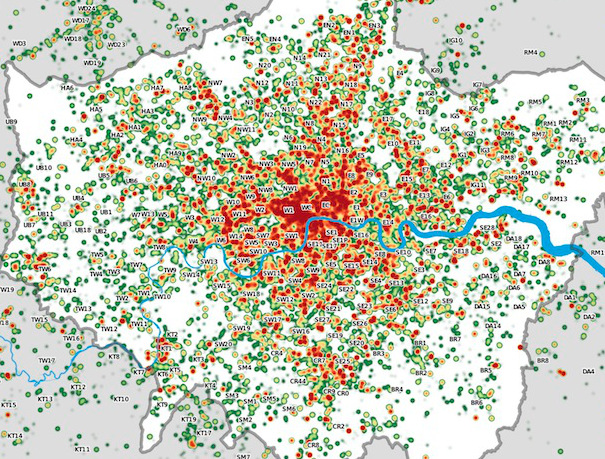
Many Twitter messages, or “tweets”, are sent with latitude/longitude information, allowing an insight into the places where the most amount of tweeting happens. For a
More...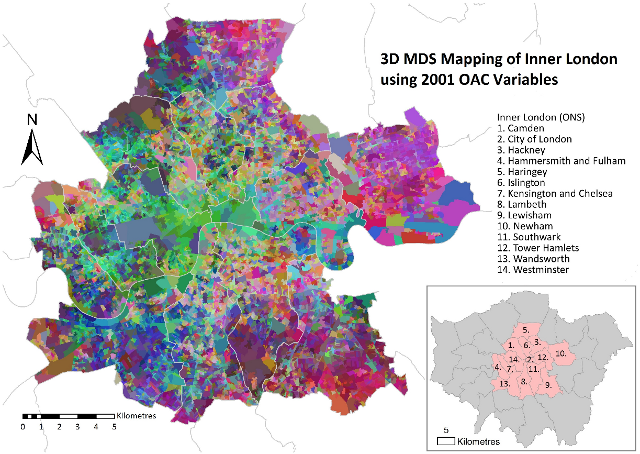
Daniel Lewis, a Geography Ph.D student at UCL, has produced this map of inner London, using multidimensional scaling (MDS) to simultaneously depict 41 geodemographic measures of each area.
More...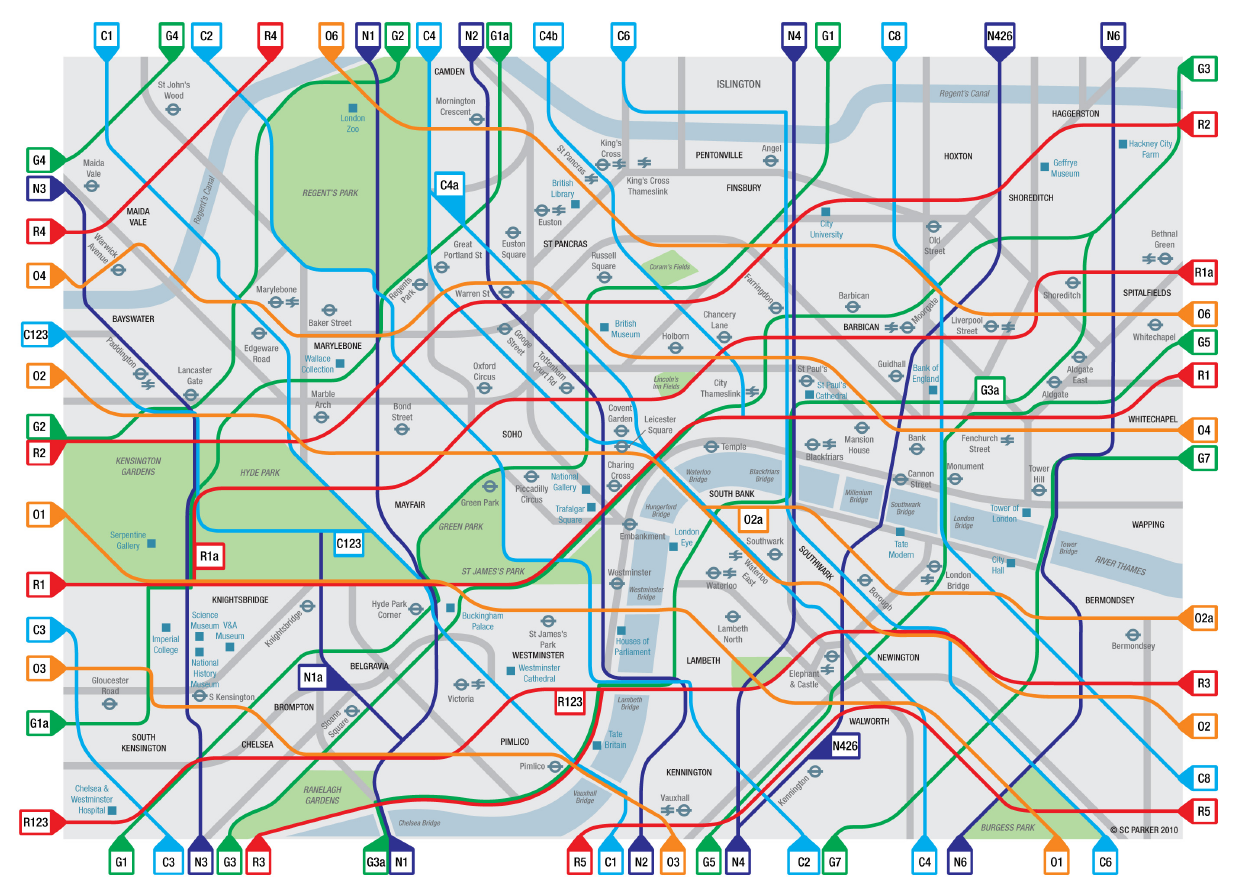
Congratulations to Cycle Lifestyle, who have won £6000 in funding for “creating a colour coded Tube style map of the Capital’s cycling network” in the
More...
Readers may be interested in the London Mapping Festival, a grouping of several events relating to mapping in London, that takes place over the next
More...