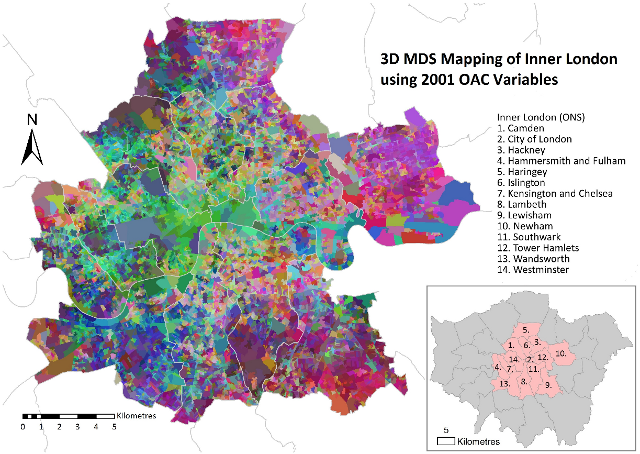

Daniel Lewis, a Geography Ph.D student at UCL, has produced this map of inner London, using multidimensional scaling (MDS) to simultaneously depict 41 geodemographic measures of each area, which are used in the Output Area Classification. Most of the measures are from the 2001 census.
The colours themselves don’t have any significance – the hues used are arbitrary groupings based on computed correlations between variables – but the differences in colour between two areas indicate a distinct demographic difference between the areas.
Daniel talks in more detail about the map on his blog. In the post, he suggests that areas which contain similar colours represent the distinct “villages” that make up inner London.
Census data is Crown Copyright 2010 from CasWeb, boundaries are Crown Copyright 2010 from UKBorders, an Edina/JISC supplied service.