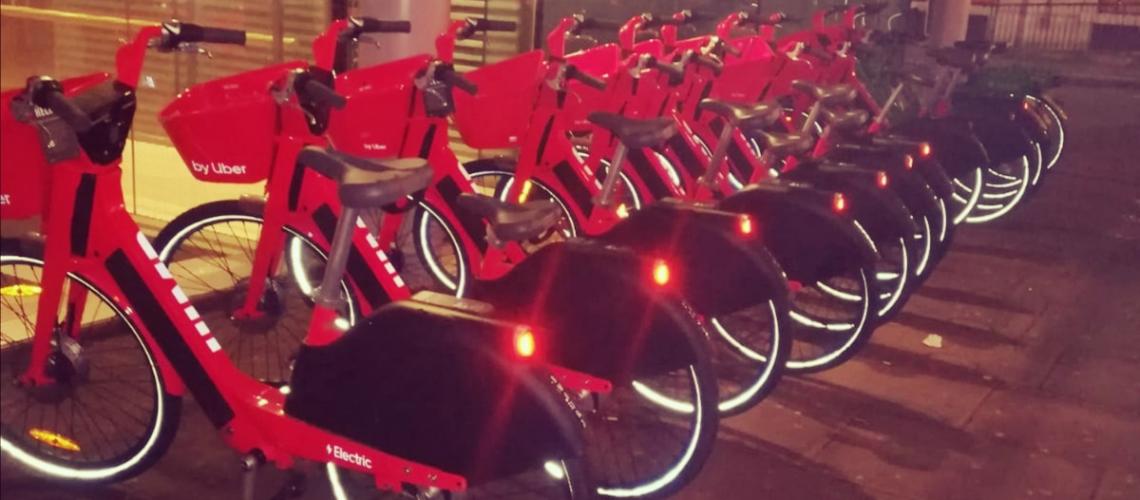
The bright red JUMP bikes are alas gone from the streets of London, following the takeover of Uber’s JUMP micromobility division by rival Lime. They may be back on the streets, maybe painted green, soon. But for now, we can view this amazing datamap of where they went during in Q1 2020 (January to March this year), using the Uber Movement platform. The data is also downloadable.
The fleet was as large as 1800 bicycles in summer 2019, but dwindled to around 600 during the early part of 2020, before disappearing completely earlier in June. The bikes were allowed to be left in Islington and Camden boroughs, and later Hackney and Kensington & Chelsea. Notably, this didn’t include the City of London, so piles of the bikes were often clustered at the boundary of the City on weekday mornings, particularly around Finsbury Square, where Hackney, Islington and the City meet. It also didn’t include Westminster (shown as Chinatown and Maida Vale in the maps here).
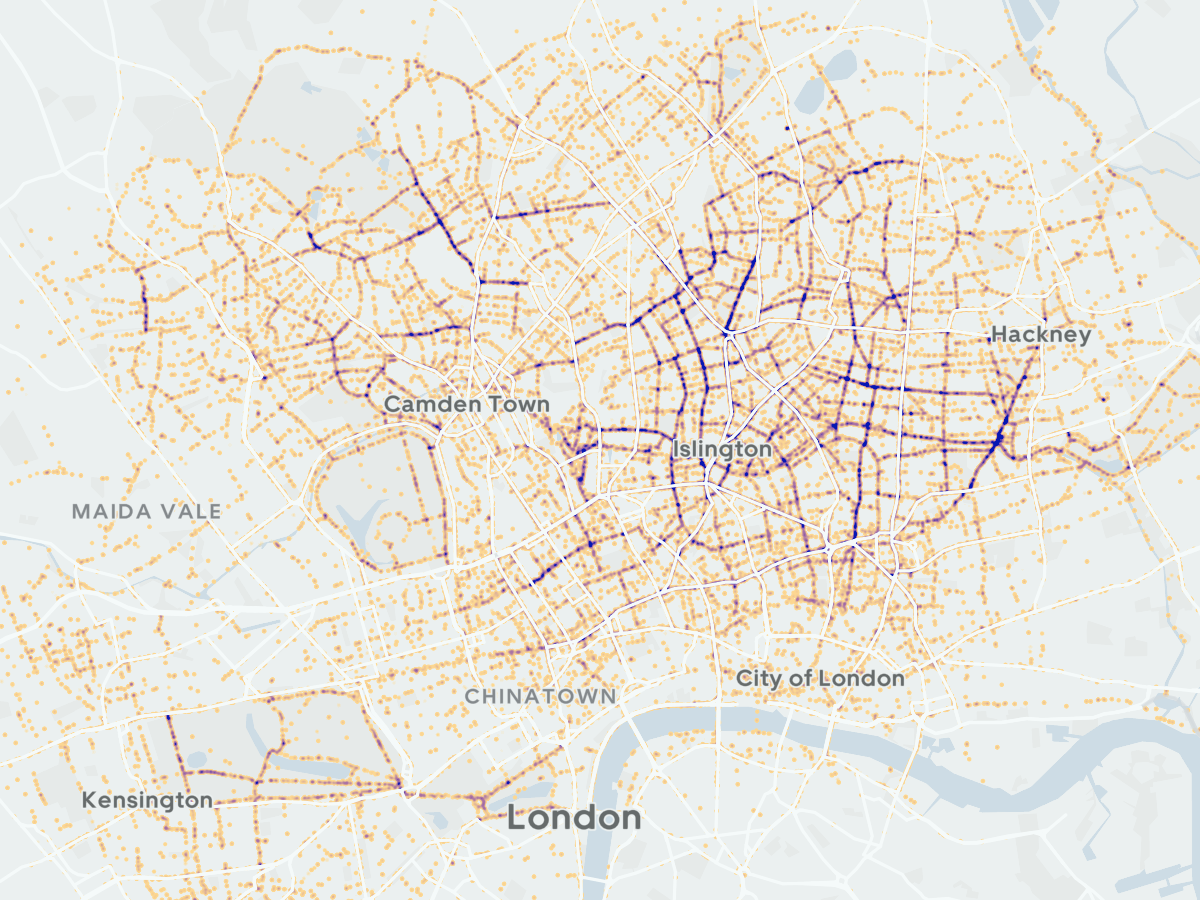
The weekday vs weekend differences in the maps tell the story of how people move around inner north London – the emphasis is on north-south journeys down towards the City during weekdays, with cross-way journeys mainly appearing closer to the centre of London, particularly the “Route 0” running just to the south of Euston Road, which is well know as one of central London’s principal cycle routes.
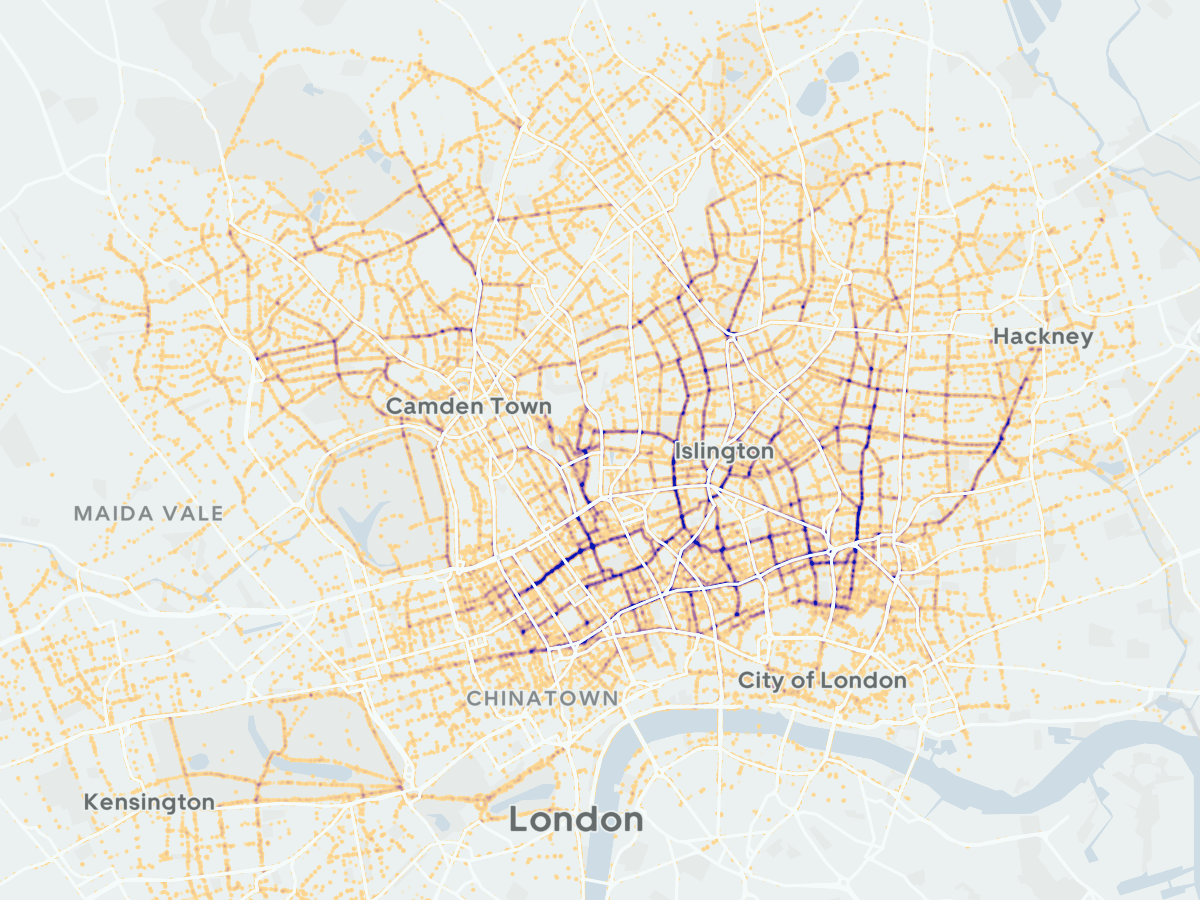
Conversely, Broadway Market in the east, Hampstead Village in the west and Highbury Fields in the north are three key destinations for bikeshare users at weekends – where there is no strong directional flow. Closer to the centre of London, where Santander Cycles competes, the flow is noticeably smaller, than further north. There’s also a sizeable usage of Victoria Park and Hyde Park – both large ornamental parks with good cycling routes – but both also in boroughs which don’t allow the parking of JUMP bikes.
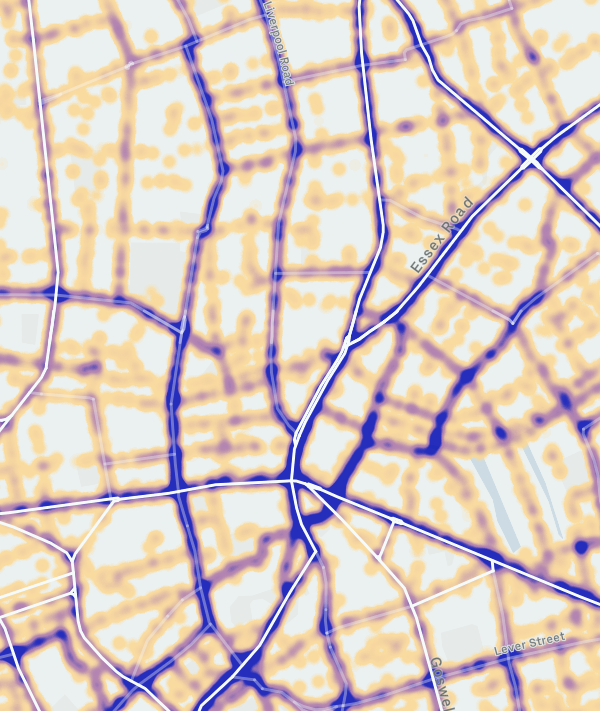
This is a great example of using heatmaps to show transport data like this. Even though the data itself is simply GPS readings, you can clearly see street networks appearing. Simple controls allow fading of the data, while a timeslider lets a period of the day be selected. The yellow-orange-purple colour ramp effectively communicates the intensity of the activity, while a muted background provides the right amount of context. One cartography error though is to show main roads as white lines on top of the data. This as the effect of substantially hiding the data at certain zoom levels, so emphasising minor-roads with similar JUMP volumes.
It’s a great shame the bicycles were never allowed to realise their full potential, thanks to the politics of 32 London boroughs with different policies. Electric bikes like these, in particular, would have been excellent for cross-borough journeys. They cost more than public transport, but were a lot more fun to use and often quicker too. For now, we have these glimpses into how the Santander Cycles network might fare if they were extended into the obvious “cycle culture” parts of north London.
More likely, the JUMPs will be back, managed by Lime, and will be competing with a new wave of micromobility – escootershare, very likely coming to many parts of London (and the rest of the UK) later this summer.
JUMP Bikeshare Routes — https://t.co/cMZgQeqhcg
Where the bicycles went: Heatmap from Uber Movement, showing routes in north London taken on bright red JUMP pedele… https://t.co/G9lFnLMC9g
RT @MapLondon: Where the bicycles went: Heatmap from Uber Movement, showing routes in north London taken on bright red JUMP pedelecs in Q1…
RT @MapLondon: Where the bicycles went: Heatmap from Uber Movement, showing routes in north London taken on bright red JUMP pedelecs in Q1…
JUMP Bikeshare Routes https://t.co/fSziTyTiHp
RT @MapLondon: Where the bicycles went: Heatmap from Uber Movement, showing routes in north London taken on bright red JUMP pedelecs in Q1…
RT @MapLondon: Where the bicycles went: Heatmap from Uber Movement, showing routes in north London taken on bright red JUMP pedelecs in Q1…
The south doesn’t exist