
This was the submission by the Mapping London editors into the 10×10 Drawing the City London 2013 art event, which was a charity auction run by Article 25. The graphic shows nine different census results for the area around Shoreditch in east London. A single print was produced on canvas, bound by UCL Geography’s Drawing Office, and presented for the auction at the Granary Building in King’s Cross late last year, where it received four bids and raised £140 for good causes.
You can find more about the work in the blog posts by James andOllie. The following explanatory notes were on a sheet accompanying the artwork:
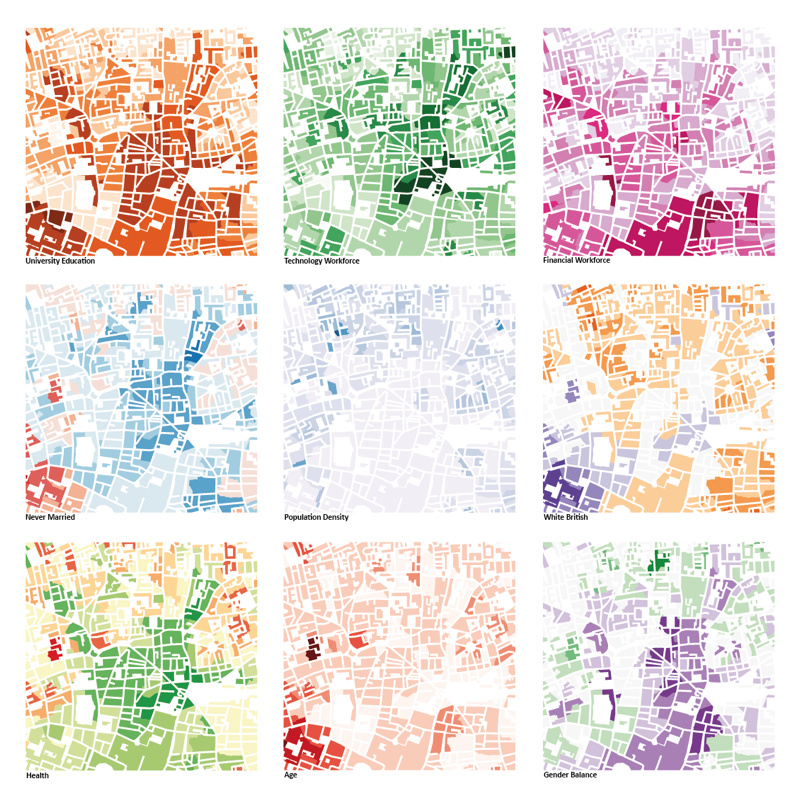
This work shows demographic information from the 2011 Census, broken out by Output Area and clipped to buildings within the 10X10 project area. The data is based on where people live, not where they work.
Windows:
- University Education: Proportion of population educated to Level 4 (equivalent to higher education certificate) or above.
- Technology Workforce: Proportion of population employed in the information and communication industry sector.
- Financial Workforce: Proportion of population employed in the financial and insurance industry sector.
- Never Married: Proportion of population that has never married. Bluer colours indicate a higher proportion.
- Population Density: Residential population density.
- White British: Proportion of population that consider themselves to be White British. Purpler colours indicate a higher proportion.
- Health: Proportion of population that consider themselves to be in Very Good Health. Greener colours indicate a higher proportion.
- Age: Mean age of the residential population.
- Gender Balance: Male to female ratio. Purpler colours indicate a higher proportion of males.
Source: Office for National Statistics licensed under the Open Government Licence v.1.0. Contains Ordnance Survey data © Crown copyright and database right 2013.
Created by James Cheshire and Oliver O’Brien at the Centre for Advanced Spatial Analysis, part of The Bartlett at UCL. James and Oliver curate the Mapping London blog.
One comment