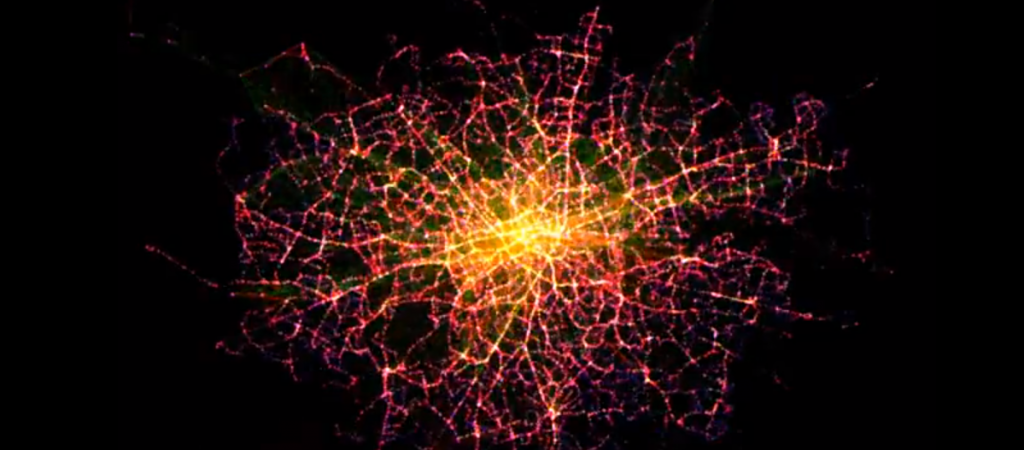
This animation, produced by Jay Gordon, does a great job of capturing the daily flows of London’s commuters. It combines the 16 million or so daily transactions made with London’s Oyster cards with vehicle-location data from the city’s 8,500 buses to infer journeys of approximately 3.1 million Oyster users. After inferring the times and locations of each bus boarding and alighting, bus and rail transactions are combined to reconstruct each cardholder’s daily travel history. If you are really keen to see how this was done, the work behind this formed part of Jays’s masters thesis.
This is a cross- post from Spatial.ly

One comment