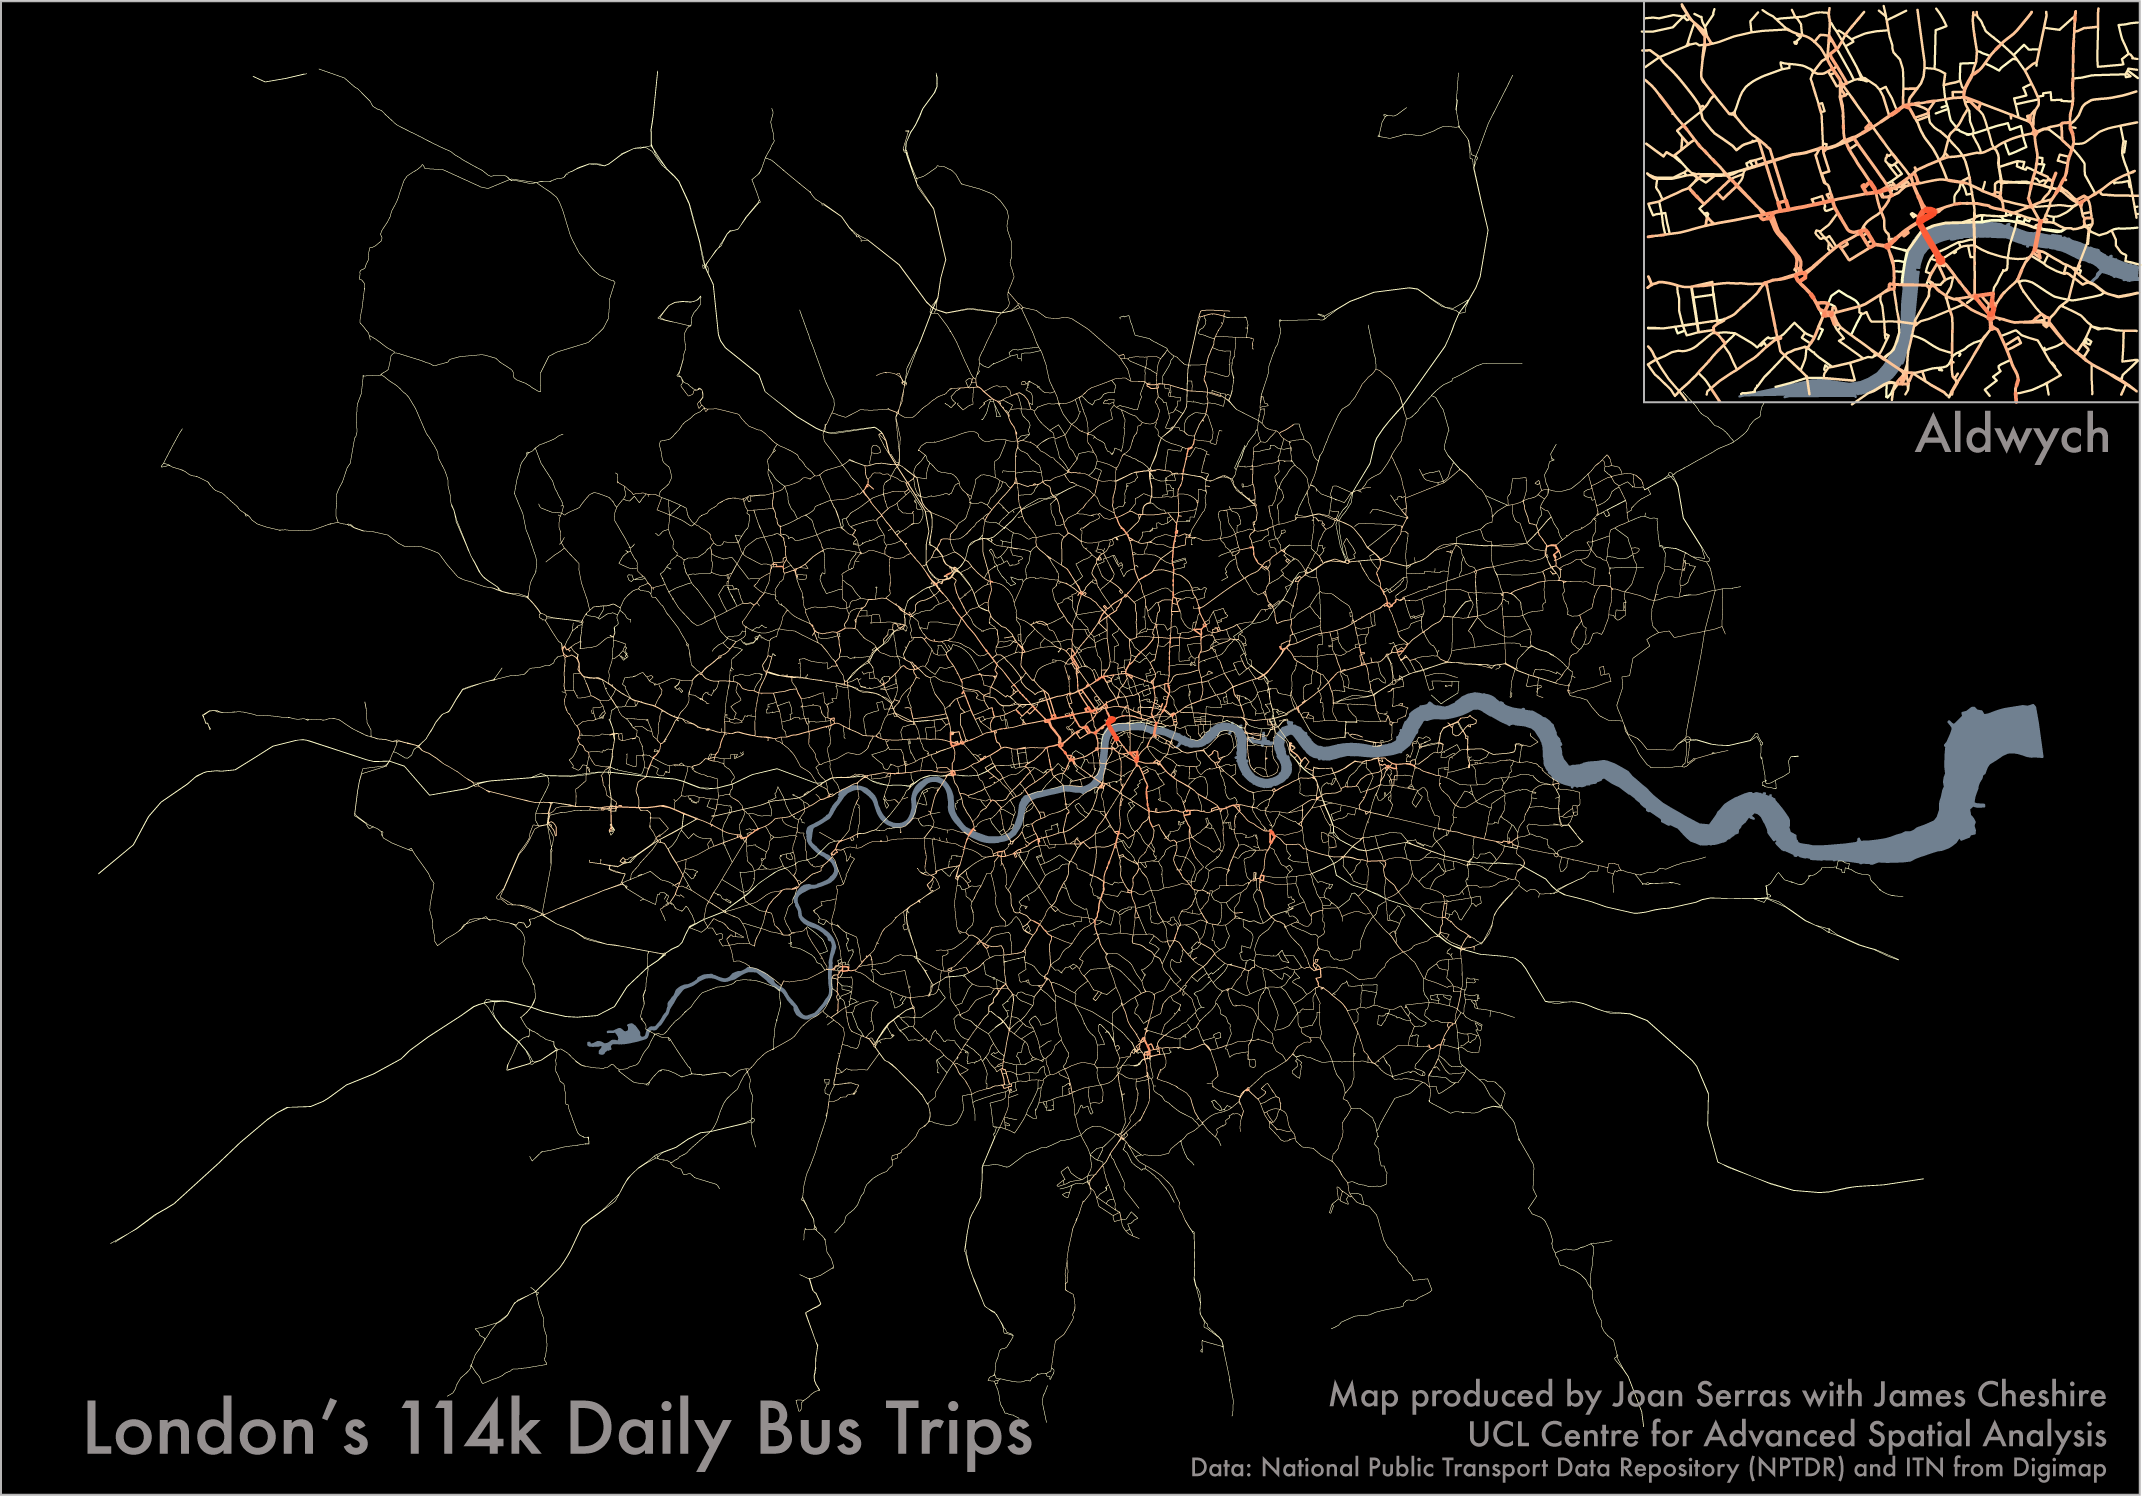

People often say “I waited ages for a bus and then they all turned up at once”. As the map above shows if all the timetabled buses in London literally did show up at the same time you would be stuck in an impressive traffic jam. It represents the 114 thousand or so bus trips that are completed every day in London (a trip corresponds to a single bus completing its route). Roads with more buses running along them are wider and redder, those with fewer buses are narrower and yellower and those with no buses have been excluded. The map demonstrates the impressive coverage of London’s bus network and how integral it is to London’s transport infrastructure.
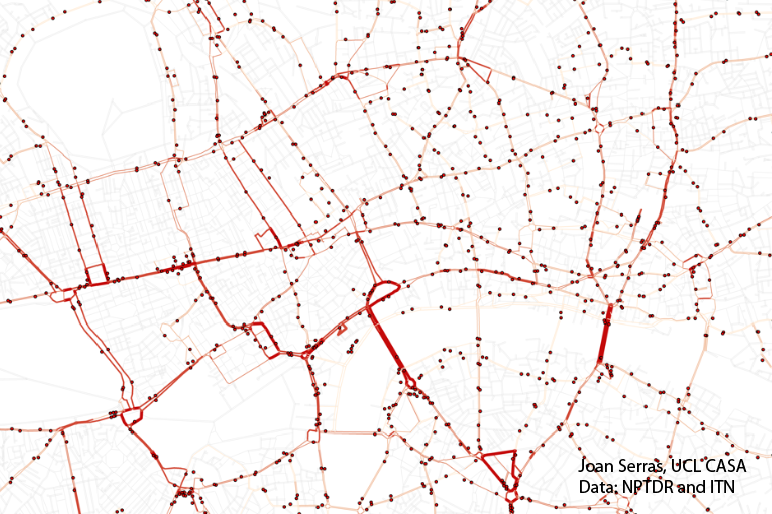
Joan Serras (the data guru who also produced the above video last year) calculated the routes* between each of the bus stops in London and used the timetables to calculate how many times a bus passes along them. This method is an improvement on previous work (and the video), which has simply assumed the buses travel in a straight line between stops- in the map above the buses follow the road network. The map’s simplicity disguises the fact that it contains routing information calculated between 22,565 bus stops (in the GLA and a little bit beyond). You get a sense of this complexity if you take a look at the underlying spatial data (see below: each dot is a bus stop).
The top map will be on display as part of CASA’s Smart Cities Conference taking place this Friday.
*This is the shortest route between two bus stops using as cost a measure of travel time deduced using the length and the speed limit on each road link.
Hey guys,
I’ve been doing similar stuff. Curious what routing software you used? ArcGIS? PgRouting?
Nice work.
J
I actually coded the Dijkstra algorithm into c++ myself, that’s what has been used to route between pairs of bus stops.
Thanks!
Hi Joan. I’m interested in making a similar map out of recently published data for my own city. Do you have any published libraries or tools or is it all home grown? I’m very interested as a developer but I’ve not done much with visualization. Thanks! -Blaine
Impressive work, Joan! so, now what’s next? Improve the bus system in London in the city…
Thanks Francesc.
Next, there are many things one can do, but we’re aiming for running a multimodal transport model for London.
Do you know the job of Pedro Miguel Cruz in LIsbon, in 2009?
http://vimeo.com/10199455
Joan, its really impressive work and looking forward to few more visualisations. Can it help to solve the problem of irregular bus service in design cities such as Milton keynes.
We have just created this video. It was build with the GTFS file of the Dutch Railways. In essence it can convert any GTFS to an animation. I have created one script that can do this interpolation based, and for the video it really transform GTFS into a Blender animation. Script will be polished up [so it doesn’t need any other requirements], and published soon 🙂