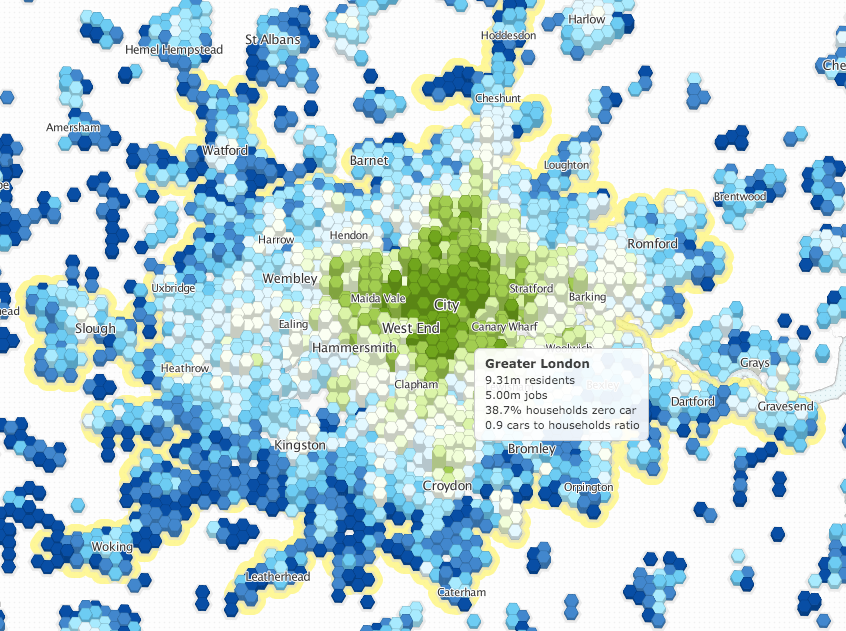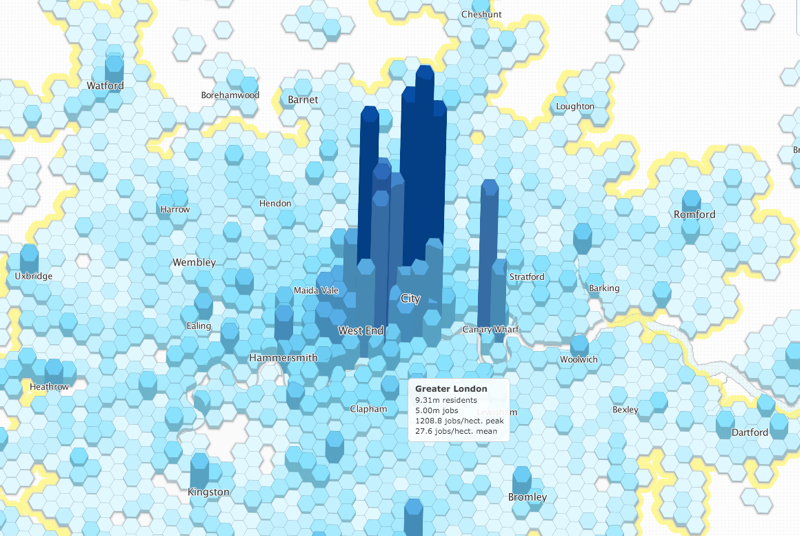
Luminocity3D, an “urban density and dynamics explorer”, is a interactive mapping website developed by UCL CASA’s Duncan Smith, which shows a number of urban demographics for London and other UK urban areas, using an innovative hexagonal grid and a 3D effect to emphasise values. The above view shows how the proportion of London’s “Zero Car Households” varies across the capital, with colours showing the proportion, and the height of each hexagonal area showing the residential population of that area. London’s “Zero Car” distribution can easily be seen to be radial, with only a few places beyond the inner city having noteable zero-car populations – Barking and Croydon.
A number of other census and other metrics are included, selectable via a simple dialog on the top right. I would be remiss not to mention my own project, DataShine, which has similar goals – it maps these datasets in a different way, colouring building plots rather than hexagons. What I really like about Luminocity3D’s approach however is its clarity and distinctiveness – it is easy to see the big picture at a glance and the interactive cues on the website make it a compelling tool to explore data with. An interactive chart is included with each map, comparing London’s result (normally an outlier, and easy to spot as it’s the biggest blob on the chart) with other urban areas in the UK.

Screenshots from the Luminocity3D website, which was featured in Nature this week.

ollie is beautiful!!! there is just sneothimg about a great dane that takes the dog-love to a human level. i’m up reading blogs at 5 am because edgar, my beautiful blue great dane, needed me to check on him. he can no longer make it up the stairs to sleep in our bed like he always did, so i’m often up in the night checking on him. 23 years of danes and i can’t imagine my life without those sweet eyes and big warm head and my feet tucked in his belly while we share the couch .although he gets most of it.thanks for your lovely post. you and ollie are both very lucky.