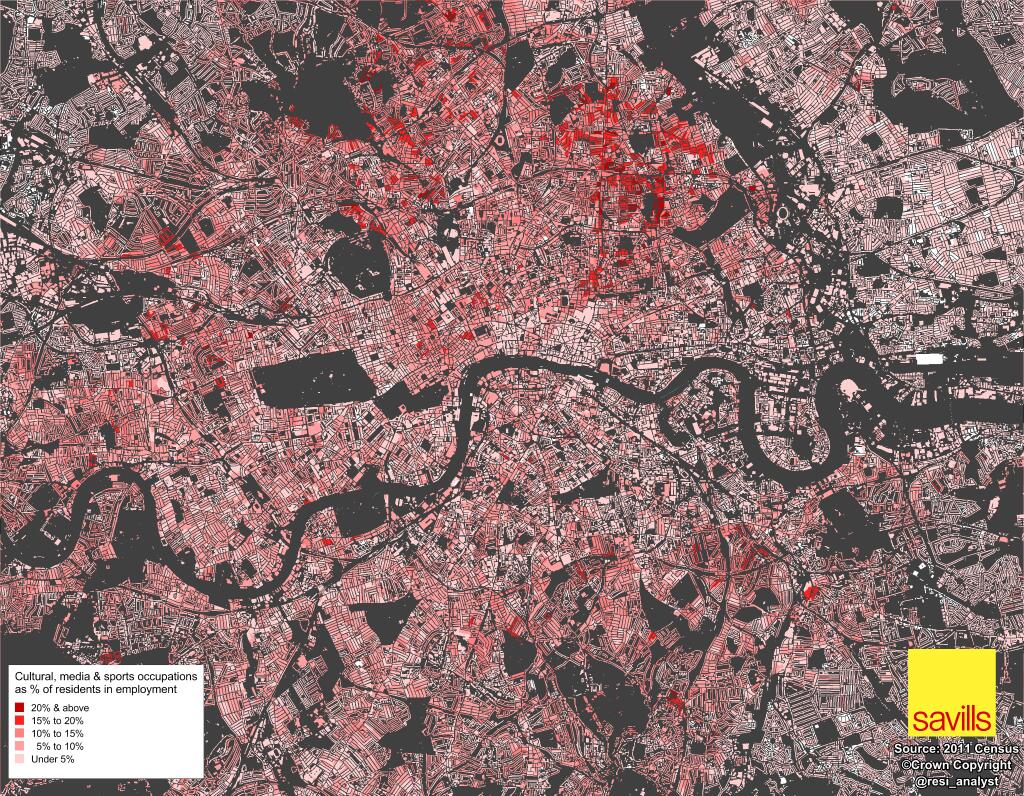

Neal Hudson, housing market analyst at Savills, has been crunching, mapping and graphing interesting results from the 2011 census, since the data started to be released a year ago. Recently he has applied a pseudo-dasymetric technique to show more of London’s building structure alongside the census data, rather than just the classic choropleth style maps of, for instance, my CensusProfiler from 2001.
Above is his most recent map, showing where, in central and inner-city London, people who work in the “cultural, media and sports” occupational sector live. The area around London Fields in Hackney seems to be a focal point, and looking at the map, it becomes more clear why Here East (formerly iCity and formerly the giant International Broadcast Centre for London 2012) is an obvious location for a creative/media and sporting hub. BT Sport are already based in the facility, which is the large building a bit north of the Olympic Stadium, itself revealed as a slender ring on the right side of the map. Here East is only a mile or so east of a huge area where people, who work in the same sector, live, and it’s just a couple of stops east from Hackney Central (itself close by London Fields) on the Overground – so avoiding a central-London commute.
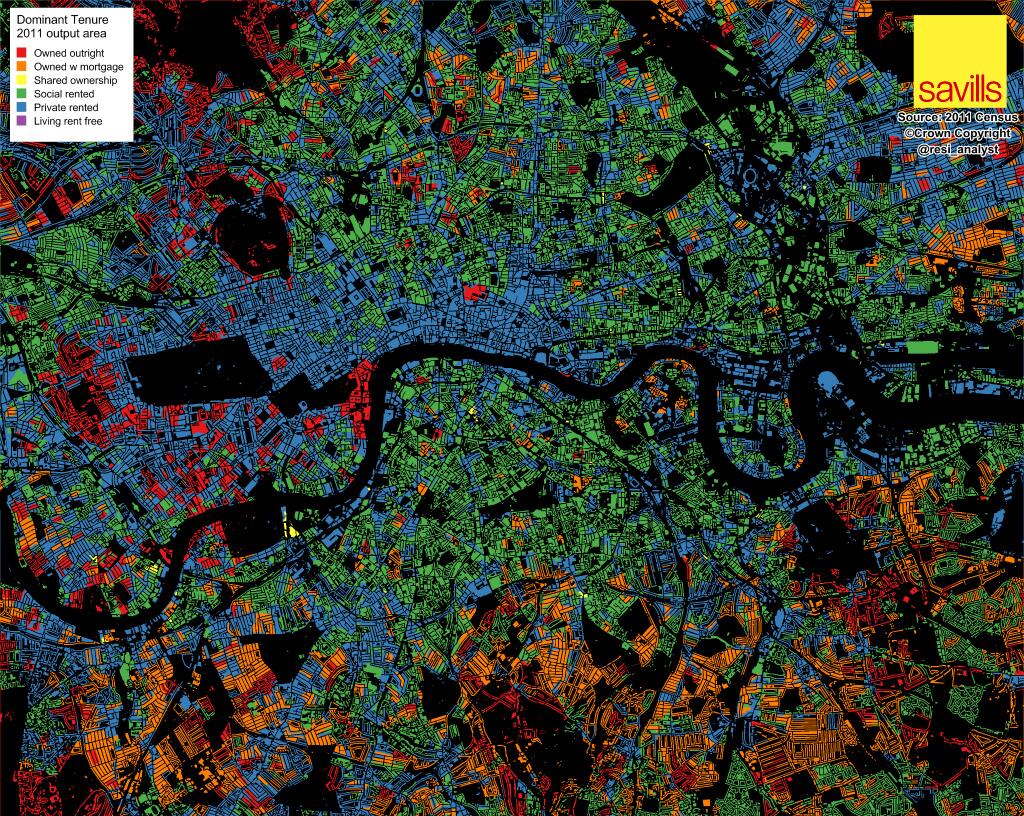
Another similar map by Neal, below, shows the most common housing tenure type, for the same area:
One comment