

The HERE Urban Mobility Index profiles 30 cities around the world, looking at how connected, sustainable, affordable and innovative they are, relating to urban mobility – the options that people have to move around the city area. London is one of the cities and scores first place for its public transport efficiency and low emission zone coverage, however its score is pushed down by its poor traffic flow (which is no surprise as it correlates inversely with public transport efficiency) and relatively expensive public transport fares (with respect to monthly incomes of its residents).
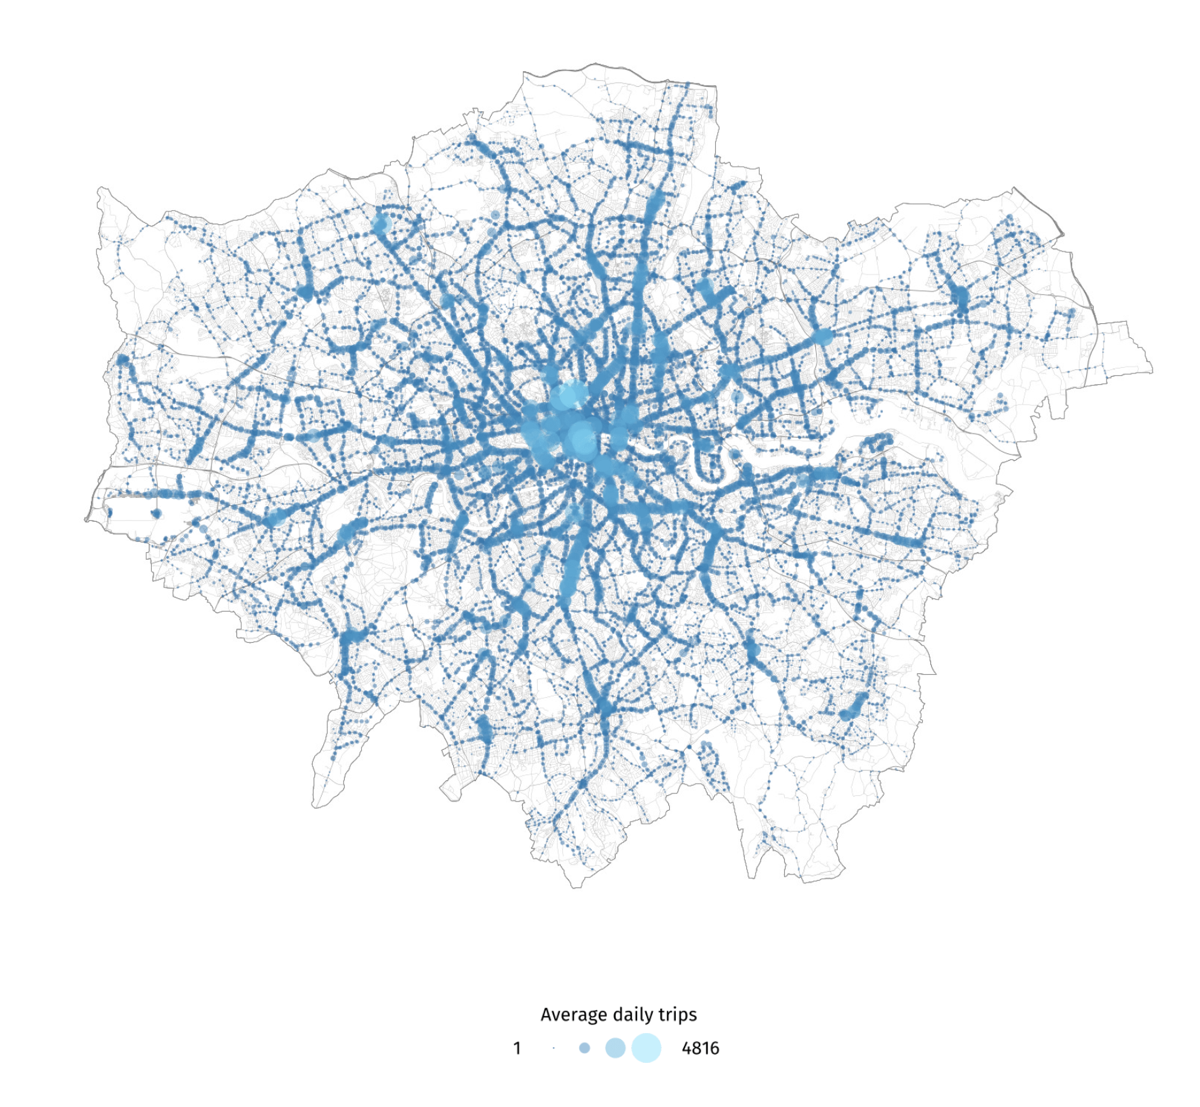
As part of the dissemination of the urban mobility index results, HERE have produced a set of maps – the map at the top is a “placesetting” map for each city, showing the full public road network (with nice CSS colouring/animation), and the bottom map is a data map, showing the numbers of public transport vehicles (buses, trains, trams, metro) stopping at each stop or station throughout the city, on a typical weekday. There are several other data maps also included in the profile for each city, including coverage of mobility options regardless of frequency (London again scores well due to its dense network of bus-stops in particular), and areas of green space and low-emissions zones.
The maps are good, cleanly presented maps of the pertinent data, they are a visually effective way of summarising London’s mobility, and allow an easy comparison with the 30+ other cities in the index.
HERE Urban Mobility Index — https://t.co/Z03udtcnvG
? Mapping London Advent Calendar ? Day 17: HERE Urban Mobility Index – https://t.co/YKtdAN71sE https://t.co/N8mkyVU9JB
RT @MapLondon: ? Mapping London Advent Calendar ? Day 17: HERE Urban Mobility Index – https://t.co/YKtdAN71sE https://t.co/N8mkyVU9JB
The HERE Urban Mobility Index profiles 30 cities around the world, looking at how connected, #sustainable, affordab… https://t.co/vqnDwTtIBh