
One of my earliest projects at UCL, back in 2009, was to create a customisable online map of all the 2001 Census key statistics. The result was CensusProfiler which took many months to produce, not least because I was learning about online mapping as I created it.
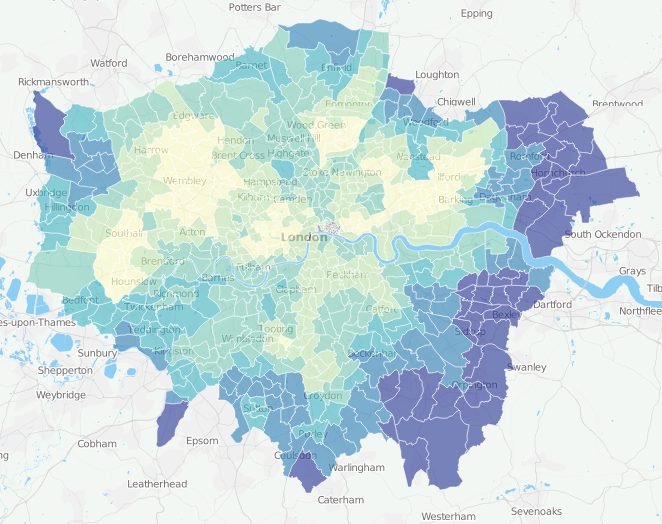
So I was pleased to discover James Trimble’s UK Data Explorer and more specifically its view of the 2011 Census for London, the data for which was released earlier this year.
James has created the map using R, D3 and Leaflet, and has based it on the Open Atlas Project which was created recently by Alex Singleton, who previously was my boss at UCL when I was working on CensusProfiler!
The map is not without its flaws – it rigidly sticks to categories that vary by at least 1% – the means that very subtle small (but interesting) population results may be hidden. The list of variables has also not been curated – instead, you get all 400 odd key statistics, including some which, for London, have a value of 0% across all areas. It also took me a while to realise that the numbers in the key are normally percentages – the crucial part of the caption being cut off sometimes by long census variable names.
The process of “curating” a large dataset for an area like this is something which a colleague of mine, Richard Milton, has been pondering, as part of his work on the GeoTalisman project.
Nevertheless, the site is a simple, quick, effective and attractive way to explore the key statistics from the 2011 census, with an underlying OpenStreetMap-based map providing the necessary context.
You can see the interactive map here.
The site also includes more information on the Open Atlas Project which includes PDF atlases of more granular census data, for each London borough.
Thanks to James for letting me know about his website.
Many thanks for featuring my map and for the helpful feedback. I have made a start with the suggested improvements by adding a decimal place to the colour bands for variables with small values. I’ve also added a percentage symbol above the colour key.
Good day,
A very useful map indeed. Are there data specifically relating to Hungarian ethnicity in London? In other words, where Hungarians live in London (within the category country of birth / accession countries 2001-2011)?
Looking forward to receiving your answer.
Kind regards
László
For small areas, like the DataShine maps – no, Hungarians are not broken out as their population is too low. But you can use a proxy, like the areas of London where Hungarian is spoken – http://datashine.org.uk/#table=QS204EW&col=QS204EW0024&ramp=YlOrRd&layers=BTTT&zoom=12&lon=-0.1500&lat=51.5200 reveals parts of Haringey and Barnet. I’m presuming it’s reasonable to assume a high correlation between Hungarian speakers and people who were born in Hungary. This may not be the case – you’ll may well know better than me.
If you do specifically want Country of Birth, then Hungary only gets its own count at a pan-London level, in table QS213EW (see Nomisweb).