
Today, a new version of the Greater London Authority (GLA)’s London Datastore launches, with an updated look, a new responsive data dashboard, and various new datasets being made available, including two key geodemographic datasets – that is, datasets which succinctly describe the population of an area.
LOAC
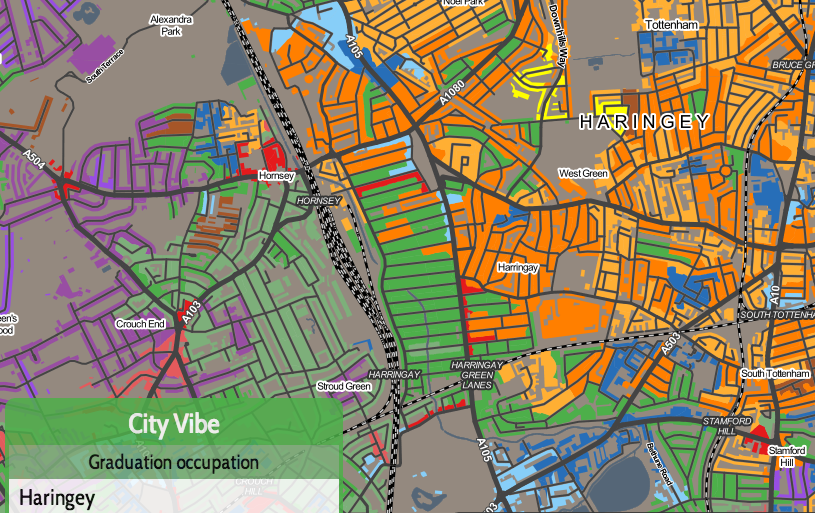
One set, produced by Dr Alex Singleton at the University of Liverpool, is the London Output Area Classification (LOAC). LOAC looks purely at recent census area data for just London, using similarity clustering to put each of ~32000 small London areas into one of 8 groups (each then subdivided into 2-4 subgroups for further insight).
I’ve taken this dataset and produced the LOAC Map. An excerpt of part of the map for north London is above, but be sure to try the interactive version – a popup will describe the current area as you mouseover it. Buttons at the top allow you to map just a single group, to find out different areas with a similar population.
Whereabouts London
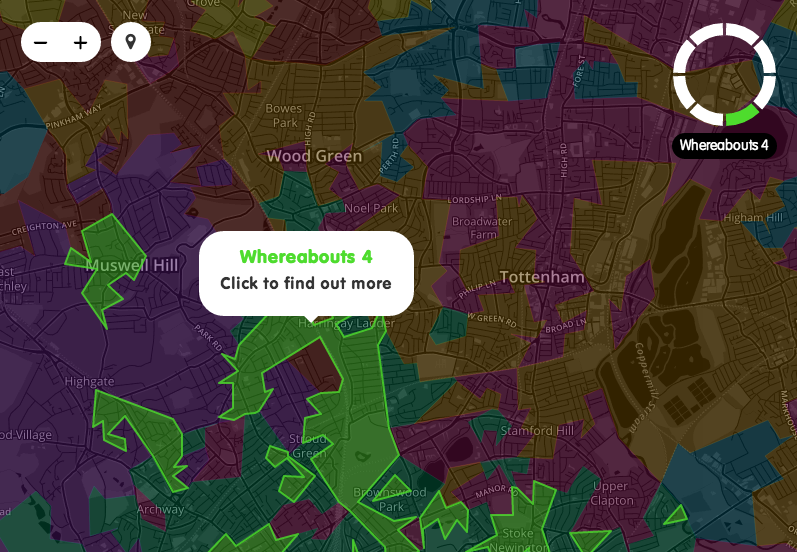
The team at Future Cities Catapult have also produced their own, alternative cluster of GLA-area aggregated data both from the census and additional more novel open sources (e.g. greenspace survey and Flickr photo numbers), again producing an interactive map (excerpt below) of 8 different classifications. The project is called Whereabouts London. Here, clicking on an area will reveal a set of charts showing the typical characteristics of the grouping that the area is in. Whereabouts London is fully open source, with the code behind the clustering available on BitBucket.
Whereabouts London takes a pure-vector approach to showing the areas, with all areas that fit into each category highlighting when you mouse-over them. Similarly to LOAC, they have also used a vivid colour palette. The website is fully responsive, so should work well for checking out an area you are in, on your smartphone.
A very interesting selection of interactive maps- especially the first one (LOAC Map)